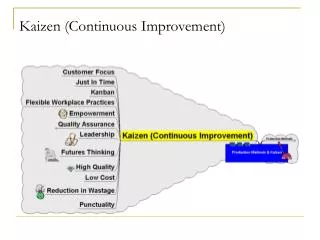
Continuous Improvement
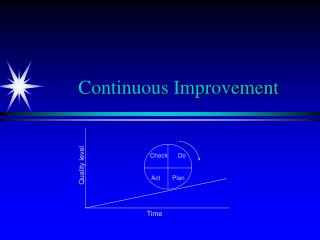
Continuous Improvement. Check Do Act Plan. Quality level. Time. Learning Objectives. Lead a Plan-Do-Check-Act (PDCA) process improvement initiative. Use quality tools for analysis and problem solving. Compare and contrast the corporate programs for quality improvement.

Continuous Improvement
E N D
Presentation Transcript
Continuous Improvement Check Do Act Plan Quality level Time
Learning Objectives • Lead a Plan-Do-Check-Act (PDCA) process improvement initiative. • Use quality tools for analysis and problem solving. • Compare and contrast the corporate programs for quality improvement.
Quality and Productivity Improvement Process • Foundations of Continuous Improvement - Customer Satisfaction - Management by Facts - Respect for People • Plan-Do-Check-Act (PDCA) Cycle • Problem Solving (10 steps)
Quality Tools • Check Sheet • Run Chart • Histogram • Pareto Chart • Flowchart • Cause-and-Effect Diagram • Scatter Diagram • Control Chart
Check Sheet Month Lost Departure Mechanical Overbooked Other Luggage Delay January 1 2 3 3 1 February 3 3 0 1 0 March 2 5 3 2 3 April 5 4 4 0 2 May 4 7 2 3 0 June 3 8 1 1 1 July 6 6 3 0 2 August 7 9 0 3 0 September 4 7 3 0 2 October 3 11 2 3 0 November 2 10 1 0 0 December 4 12 2 0 1 Total 44 84 24 16 12
Cause-and-Effect Chart for Flight Departure Delay (Fishbone Chart) Equipment Personnel • Gate agents cannot process passengers quickly enough Too few agents Aircraft late to gate Agents undertrained Late arrival Agents undermotivated Gate occupied Agents arrive at gate late Other Mechanical failures Late cabin cleaners Late pushback tug Weather Late or unavailable cabin crews Air traffic Late or unavailable cockpit crews Delayed Flight Departure Poor announcement of departures Weight and balance sheet late Delayed checkin procedure Late baggage to aircraft Confused seat selection Late fuel Passengers bypass checkin counter Late food service Checking oversize baggage Issuance of boarding pass Acceptance of late passengers Cutoff too close to departure time Desire to protect late passengers Material Desire to help company’s income Poor gate locations Procedure
Control Chart of Departure Delays expected Lower Control Limit 1998 1999
CorporatePrograms for Quality Improvement • Marriott Personnel Programs • Zero Defects (Crosby) • Deming’s 14 Point Program • Malcolm Baldrige Quality Award • ISO 9000 • Six-Sigma
Mega Bytes Restaurant • How is the Seven-Step Method (SSM) different from Deming’s PDCA cycle? • Prepare a cause-and-effect or fishbone diagram for a problem such as “Why customers have long waits for coffee.” Use Figure 6.30 as a guide. • How would you resolve the difficulties that study teams have experienced when applying the SSM?
The Seven-Step Method • Step 1: Define the project • Step 2: Study the current situation • Step 3: Analyze the potential causes • Step 4: Implement a solution • Step 5: Check the results • Step 6: Standardize the improvement • Step 7: Establish future plans