Measurement and Sampling in Business Studies
390 likes | 419 Vues
Explore how measuring connects abstract ideas with empirical observations, using quantitative and qualitative methods for data collection. Learn about reliability, validity, and levels of measurement to enhance research in business studies.

Measurement and Sampling in Business Studies
E N D
Presentation Transcript
MEASUREMENT & SAMPLING BUSN 364 – Week 9 Özge Can
Measurement • It connects invisible ideas or concepts in our mind with specific things we do or observe in the empirical world to make those ideas visible • It lets us observe/ helps to see things that were once unseen and unknown but predicted by theory • We need measures: • To test a hypothesis, evaluate an explanation, provide empirical support for a theory or study an applied issue
Measurement • Physical world or features are easier to measure • E.g. age, gender, skin tone, eye shape, weight • Measures of the nonphysical world are less exact • E.g. attittudes, preferences, ideology, social roles • “This restaurant has excellent food”, “Deniz is really smart”, “Ali has a negative attitude towards life”, “Mert is very prejudiced”, “Last nights’s movie contains lots of violence”
Quantitative and Qualitative Measurement • Quantitative mesurement: • It is a distinct step in the research process that occurs before data collection • Data are in a standardized, uniform format: Numbers • Qualitative measurement: • We measure and create new concepts simultaneously with the process of gathering data • Data are in nonstandard, diverse and diffuse forms
Measurement Process Two major steps: 1. Conceptualization => the process of developing clear, rigorous, systematic conceptual definitions for abstract ideas/concepts • Conceptual definition: A careful, systematic definition of a construct that is explicitly written down
Measurement Process 2. Operationalization => Process of moving from a construct’s conceptual definition to specific activities or measures that allow the researcher to observe it empirically • Operational definition: A variable in terms of the specific actions to measure or indicate in the empirical world
Reliability • Dependebility or consistency of the measure of a variable • The numerical results that an indicator produces do not vary because of the characteristics of the measurement process or instrument • E.g. A reliable scale shows the same weight each time
Reliability • How to Improve Reliability? • Conceptualization: clearly conceptualize all constructs • Increase the level of measurement: detailed info the measurement shows • Use multiple indicators of a variable: triangulation • Use pilot studies and replication
Validity • How well an empirical indicator and the conceptual definiton “fit” together • The better the fit, the higher the validity • Four types of measurement validity: • Face validity • Content validity • Criterion validity • Construct validity
Validity • Face Validity:It is a judgement by the scientific community that the indicator really measures the construct. • The construct “makes sense” as a measurement
Validity • Content Validity: Requires that a measure represent all aspects of the conceptual definition of a construct • Is the full content of a definition represented in a measure?
Validity • Criterion Validity: Uses some standard or criterion to indicate a construct accurately. Validity of an indicator is verified by comparing it with another measure • Concurrent and predictive validity
Validity • Construct Validity: Is for measures with multiple indicators. Do the various indicators operate in a consistent manner? • Convergent and divergent validity
Relationship between Reliability and Validity • Reliability is necessary for validity and easier to achieve BUT • It does not guarantee that the measure will be valid! • Sometimes there is a trade-off between them: • As validity increases, reliability becomes more difficult to attain or vice versa
Levels of Measurement • A system for organizing information in the measurement of variables. It defines how refined, exact and precise our measurement is. • Continuous variables: Variables that contain large number of values or attributes that flow along a continuum • Ex: temperature, age, income, crime rate • Discrete variables: Variables that have a relatively fixed set of separate values or attributes • Ex: gender, religion, marital status, academic degrees
Levels of Measurement The four levels from lowest to highest precision: • Nominal: indicates that a difference exists among categories • Ordinal: indicates a difference and allows us to rank order the categories • Interval: does everything the first two do and allows us to specifiy the amount of distance between categories • Ratio: does everything the other levels do and it has a true zero.
Levels of Measurement *Discrete variables are at nominal or interval levels *Continuous variables are at interval or ratio levels
Principles of Good Measurement • Mutually exclusive attributes: • An individual or case will go into one and only one variable category • Exhaustive attributes: • Every case has a place to go or fits into at least one of a variable’s categories • Unidimensionality: • A measure fits together or measures one single, coherent construct
Scales and Indexes • Scale => a measure in which a researcher captures the intensity, direction, level or potency of a variable and arrange responses/observations on a continuum • Likert Scale: ask people whether they agree or disagree with a statement • Index => a measure in which a researcher adds or combines several distinct indicators of a construct into a single score • Ex: crime index, consumer price index
Sampling • Sample: a small set of cases a researcher selects from a large pool and generalizes to the population • Population: large collection of cases from which a sample is taken and to which results from a sample are generalized
Sampling • In quantitative research: • Primary use of sampling is to create a representative sample. If we sample correctly, we can generalize its results to the entire population • We select cases/units and treat them as carriers of aspects/features of a population • Probability sampling techniques
Sampling • In qualitative research: • Primary use of sampling is to open up new theoretical insights, reveal distinctive aspects of people or social settings, or deepen understanding of complex situations, events, relationships • We sample to identify relevant categories at work in a few cases • We do not aim for representativeness or generalization • Non-probability sampling techniques
Probability Sampling • It is the “gold standard” for creating a representative sample • We start with conceptualizing a target population • We then create an operational definition for this population: sampling frame • A list of cases in a population or the best approximation of them • E.g. telephone directories, tax records, school records • We choose a sample from this frame
Probability Sampling Model of the Logic of Sampling:
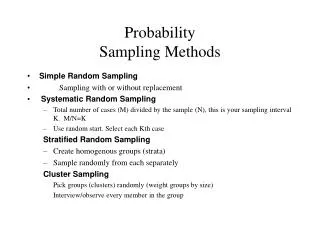
Probability Sampling • Probability samples involves randomness • Random sampling => using mathematically random method so that each elements will have an equal probability of being selected • Four ways to sample randomly: • Simple random sampling • Systematic sampling • Stratified sampling • Cluster sampling
Probability Sampling Simple random sampling: Using a pure random process to select cases so that each elements in the population has equal probability of being selected Systematic sampling: Everyting is the same as in simple random sampling except, instead of using a list of random numbers, we calculate a sampling interval (i.e. 1 in k, where k is some number) There should not be some kind of pattern in the list
Probability Sampling Stratified sampling: We first divide the population into sub-populations (strata) and then use random selection to select cases from each category Example categories => gender, age, income, social class Cluster sampling: Uses multiple stages and is often used to cover wide geographic areas. Units are randomly drawn from these clusters. Addresses two problems: 1) lack of a good sampling frame for a dispersed population, 2) high costs to reach an element
How LargeShould a SampleBe? • The best answer is: It depends! • It depends on population characteristics, the type of data analysis to be employed, and the degree of confidence in sample accuracy is needed • Large sample size alone does not guarantee a representative sample • For small populations we need a large sampling ratio, while for large populations the gain is not that big • Everything else being equal, the larger the sample size, the smaller the sampling error
Nonprobability Sampling Convenience sampling (Availability/accidental sampling): A nanrandom sample in which the researcher selects anyone he or she happens to come across. Quick, cheap and easy but very unrepresentative Quota sampling: Researcher first identifies general categories and then select cases to reach a predetermined number in each category
Nonprobability Sampling Purposive sampling (Judgmental sampling): getting all possible cases that fit particular criteria, using various methods It is mostly used in exploratory research or in field research. Often used for difficult-to-reach, specialized populations Snowball sampling: The researcher begins with one case, and then, based on information from this case, identifies other cases. Begins small but becomes larger. A method for sampling the cases which are in an interconnected network
Nonprobability Sampling Deviant case sampling (Extreme case sampling): The goal is to locate a collection of unusual, different or peculiar cases that are not representative of a whole We are interested in cases that differ from the dominant pattern, mainstream Theoretical sampling: Selecting cases that will help reveal some features that are theoretically important about a particular setting/ topic. A theoretical interest guides the sampling