Epidemiology Homework Concept Map Rubric and Study Designs
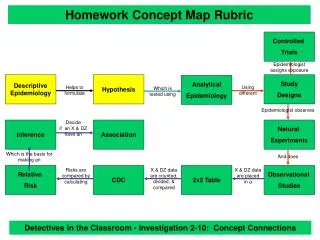
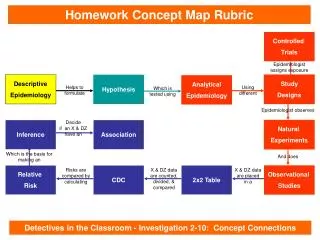
This resource helps students understand the basis for making an epidemiology concept map rubric. It covers various study designs, from observational studies to controlled trials, and applies descriptive and analytical epidemiology to formulate hypotheses. Through examples such as natural experiments and the CDC 2x2 table, learners explore how epidemiologists observe, count, divide, and compare data to draw inferences and assess associations.

Epidemiology Homework Concept Map Rubric and Study Designs
E N D
Presentation Transcript
Which is the basis for making an Homework Concept Map Rubric Controlled Trials Epidemiologist assigns exposure Descriptive Epidemiology Hypothesis Study Designs Analytical Epidemiology Helps to formulate Using different Which is tested using Epidemiologist observes Decide if an X & DZ have an Inference Association Natural Experiments And does X & DZ data are counted, divided, & compared Relative Risk Risks are compared by calculating CDC 2x2 Table X & DZ data are placed in a Observational Studies Detectives in the Classroom - Investigation 2-10: Concept Connections