Download
1 / 12
120 likes | 228 Vues
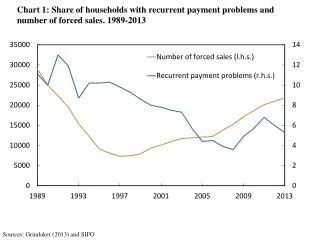
Chart 1: Share of households with recurrent payment problems and number of forced sales. 1989-2013. Sources: Grindaker (2013) and SIFO.

E N D
Chart 1: Shareof households withrecurrentpayment problems and numberofforced sales. 1989-2013 Sources: Grindaker (2013) and SIFO
Chart 2: Estimatedaverage loss ratio1) for consumption-sensitive2) and otherindustries. All banks exceptbranches and subsidiariesofforeign banks in Norway. 1997-2013 1) Loss as a percentageof lending to eachindustry. 2) Consumption-sensitive industriescomprisethefollowing: consumergoods, thefurnitureindustry, retail trade, other transport, constructionexcl. buildingprojectdevelopment and hotels and restaurants. Source: Norges Bank
Chart 3: Estimatedshareof lending to industries. All banks exceptbranches and subsidiariesofforeign banks in Norway. 1997-2013 1) Adjustedfor consumergoods and thefurnitureindustry. 2) Incl. buildingprojectdevelopment. Source: Norges Bank
Chart 4: Estimatedshareof lending to industries. All banks and mortgagecompanies in Norway exceptbranchesofforeign banks in Norway. 1997-2013 1) Adjusted for consumergoods and thefurnitureindustry. 2) Incl. buildingprojectdevelopment. Source: Norges Bank
Chart 5: Risk-weighted lending to non-financial enterprises. All banks exceptbranches and subsidiariesofforeign banks in Norway. 1997–2013 Source: Norges Bank
Chart 6: Risk-weighted lending to non-financial enterprises. All banks and mortgagecompanies in Norway exceptbranchesofforeign banks in Norway. 1997–2013 Source: Norges Bank
Chart 7: Risk-weighted lending to non-financial enterprises. BasedonDNB’s risk weights. Lending for all banks and mortgagecompanies in Norway exceptbranchesofforeign banks in Norway. 1997–2013 Sources: DNB Pillar3 report 2012 and Norges Bank
Chart 8: Banks’ annual loss ratios by industry. All banks exceptbranches and subsidiariesofforeign banks in Norway. 1997–2013 Source: Norges Bank
Chart 9: Annualpercentage rise in house prices and commercialpropertyprices. 2000-2013 Sources: Statistics Norway, Norwegian Association of Real Estate Agents (NEF), Eiendom Norge, Eiendomsmeglerforetakenes forening (EFF), Finn.no, Eiendomsverdi, IPD and Norges Bank
Chart 10: Correlationbetween house and commercialpropertyprices (IPD), annualpercentagechange. For negative values, house prices lead commercial property prices. Annual lags. 2000-2013 Sources: Statistics Norway, Norwegian Association of Real Estate Agents (NEF), Eiendom Norge, Eiendomsmeglerforetakenes forening (EFF), Finn.no, Eiendomsverdi, IPD and Norges Bank
Chart 11: Correlationbetweenbetween house and commercialpropertyprices(OPAK), annualpercentagechange.For negative values, house prices lead commercial property prices. Annual lags. 2000-2013 Sources: Statistics Norway, Norwegian Association of Real Estate Agents (NEF), Eiendom Norge, Eiendomsmeglerforetakenes forening (EFF), Finn.no, Eiendomsverdi, IPD and Norges Bank
Chart 12: Percentagechange in consumption and housinginvestment during episodes ofdeclining house prices1). Median values 1) Total of 114 episodes ofdeclining house prices and 28 housingmarketcrashes. Percentagechange in housinginvestment and consumption is measured from peak to troughof house pricecycle. Sources: Claessens, Kose and Terrones (2008 and 2009)