Download
1 / 66
660 likes | 762 Vues
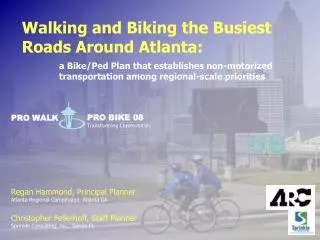
This plan aims to establish a strategic vision for prioritizing federal funds for bike/ped projects in the Atlanta region, creating a complete network for cyclists and pedestrians. By integrating non-motorized planning with regional transportation issues, it addresses congestion mitigation, air quality, mobility, safety, and more. The plan focuses on priority corridors, centers, and nodes, recognizing the importance of a full bicycle network in all streets. Performance measures, including the Bicycle Level of Service model, guide evaluation and improvement efforts. Through community engagement and policy review, it seeks to enhance biking and walking conditions in the region.

E N D
Walking and Biking the Busiest Roads Around Atlanta: a Bike/Ped Plan that establishes non-motorized transportation among regional-scale priorities PRO BIKE 08 Transforming Communities` PRO WALK Regan Hammond, Principal PlannerAtlanta Regional Commission, Atlanta GA Christopher Fellerhoff, Staff PlannerSprinkle Consulting, Inc., Tampa FL
Bike/Ped Planning in Metro Atlanta • The Bicycle: A Plan and Program for its Use as a Mode of Transportation and Recreation (1973). • ISTEA (1991) • Bicycle and Pedestrian Taskforce (1992) • Atlanta Region Bicycle Transportation and Pedestrian Walkways Plan(1993). • Updates: 1995, 2002.
Bike/PedPlanning in Metro Atlanta • All provided policy direction and included project lists • Lacked a strategic vision for the prioritization of federal funds for bike/ped in the Atlanta region. • Projects recommended did not come together to form a complete network.
Bike/PedPlanning in Metro Atlanta • New Plan developed in 2006-2007 • Established a strategic focus to integrate non-motorized planning with regionally significant transportation issues • Developed a prioritization processfor bike/ped funding assistance
Regionally Significant Issuesin Metro Atlanta • Congestion Mitigation • Air Quality • Environmental Justice • Mobility • Accessibility • Safety • Healthy Living • “Livability” Initiatives
Plan Goals and Objectives • Written to address regionally significant issues, strengthening the link between bike/ped and existing regional priorities
Priority Corridors and Centers • Roadways of the Regionally Strategic Transportation System
Priority Corridors and Centers • Regionally Significant Nodes • LCI study sites • Cities with population greater than 5,000 • County Seats • Major transit facilities • Major “activity centers”
Priority Corridors and Centers • Plan recognizes that full bicycle network includes all streets
How to Measure Performance:Conditions that Affect Cyclists • Effective Travel Width for Bicyclists • On-Street Parking Encroachments • Volume of Motor Vehicles • Speed of Traffic • Proportion of Heavy Vehicles • Pavement Surface Condition
Photo by Sprinkle Consulting, Inc. Photo by Sprinkle Consulting, Inc.
Performance Measure:Bicycle Level of Service Model Bicycle LOS = a1ln(Vol15/L) + a2SPt(1+10.38HV)2 + a3(1/PC5)2 - a4(We)2 + C Vol15 = volume of directional traffic in 15-minute time period L = total number of through lanes SPt = effective speed limit (see below) SPt = 1.12ln(SPP -20) + 0.81 SPP = Posted speed limit HV = percentage of heavy vehicles PC5 = FHWA’s five point surface condition rating We = Average effective width of outside through lane
Existing Conditions (2006) • Bicycle Level of Service • Study network of 690 miles in 18 counties • Results for 642 miles • Distance Weighted Average of 4.54 = Bicycle LOS “E”
Existing Conditions (2006) • Bicycle Level of Service = “E”
Existing Conditions (2006) • Bicycle Level of Service = “E”
Existing Conditions (2006) • Bicycle Level of Service = “E”
Latent Demand Method • Predicts probability ofnon-motorized tripsbased on proximity ofgenerators and attractors...if impedance were removed
Latent Demand Method • Used 2001 NHTS trip lengths for walking and biking for: • Work Trips ( also used for higher ed.) • Shopping • School Trips • Social Recreational Trips • Trips to Access Transit
Existing Conditions (2006) • Pedestrian Conditions • Sample analysis of longitudinal conditions at high demand nodes with Pedestrian Level of Service Model • Discussion of challenges of crossings, both at intersections and mid-block locations
Pedestrian Policy Review • PEDS Survey 2006- 6 of 13 counties had standard sidewalk requirements in place • Remaining counties had variable requirements • Staff vigilance drives action, rather than policy
Bike Policy Review • On street facilities may be included overlay districts or other special cases • Staff vigilance drives action rather than policy
Existing Conditions (2006) • Bicycle conditions are very challenging • Walking conditions are very challenging • Policies are inconsistent across the region
Needs Assessment • What level of accommodation is appropriate on this class of roadway?
Needs Assessment • Community workshops to “find the level” • Bike/Ped Levels of Service “C” chosen as a general target; • Bike Ped LOS “B” for high activity areas
Needs Assessment • Recommended strategies for improvement • LOS met • Re-striping • Widen shoulder • Detailed Corridor Study
Needs Assessment • Consideration of Alternative Routes
Needs Assessment • Consideration of Alternative Routes
Needs Assessment • Strategically evaluating projects’ contributions to regional goals requires prioritization based on those goals
Needs Assessment • Prioritization Process • Prioritization Process • Magnitude of need
Needs Assessment • Prioritization Process • Prioritization Process • Latent Demand
Needs Assessment • Prioritization Process • Prioritization Process • Congestion Measure
Needs Assessment • Prioritization Process • Prioritization Process • “Votes” from Workshops