Download
1 / 40
400 likes | 591 Vues
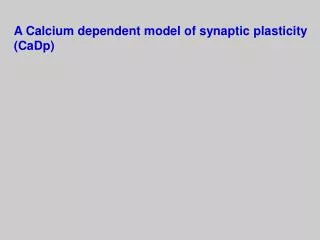
A Calcium dependent model of synaptic plasticity (CaDp). Various different protocols for inducing bidirectional synaptic plasticity. Feldman, 2000. Markram et. al. 1997. Presynaptic rate induced:. Pairing induced (postsynaptic voltage clamp).

E N D
Various different protocols for inducing bidirectional synaptic plasticity Feldman, 2000 Markram et. al. 1997 • Presynaptic rate induced: • Pairing induced • (postsynaptic voltage clamp) • Spike time dependent plasticity • (STDP)
Can a single model, based on a limited set of assumptions, account for the various induction protocols? Approach: Find a minimal set of assumptions that can qualitatively account for the various forms of induction.
θd θp LTP Ca I. A Unified theory of NMDA Receptor-Dependent synaptic plasticity Assumption 1: The calcium control hypothesis. The idea that calcium levels control the sign and magnitude of synaptic plasticity has been around for a while (Lisman, 1989; Bear et. al., 1987; Artola et. al. 1990) Ω function ΔW LTD
1 1 0.8 h 0.75 0.6 W -1 sec q q 0.5 0.4 p d 0.25 0.2 0 0 0.2 0.4 0.6 0.8 1 0.2 0.4 0.6 0.8 1 m m Ca ( M) Ca ( M) The calcium control hypothesis, is a generalization of this equation. * Where and has the form the rate function is: *This equation can be derived from a lower level biophysical formulation. (Castellani et. al. 2001, Shouval et. al. 2002)
Assumption 2: NMDA receptors are the primary source of calcium influx to spines during synaptic plasticity (Sabatini et. al 2002). Standard assumptions • Voltage dependence of NMDAR (Jahr and Stevens, 1990) Fraction of open NMDAR ICa
Ligand binding kinetics – sum of two exponentials with different time constants (Carmignoto and Vicini, 1992) • Calcium Dynamics- first order ODE NMDA receptor kinetics- sum of two exponents 0.7 0.5 0.0 NR2A+NR2B In these examples
Pairing Induced Plasticity Voltage clamping postsynaptic neuron while stimulating presynapticaly at 1 Hz. LTP/LTD curve Examples W W
Spike time dependent plasticity (STDP) STDP Curve Bi and Poo, 1998
For the calcium control hypothesis to account • for STDP it is necessary that: • For (post-pre) the calcium influx is • higher than at baseline () • For ( pre-post) the calcium influx is • higher than at ()
Back propagating action potentials Neuron – cell body | || | || | Action potentials Axon: output | | || | | | | | Synapse Dendrite: input
Back spike – assume width 3ms Assume a narrow spike (Width 3ms) • Problems: • No difference between • baseline and post-pre • Only a small elevation • in Ca for pre-post
An example of a BPAP recorded by C. Colbert from a hippocampal dendrite (slice, from 180 gm Sprague Dawley rat at 31o C , 150µM from soma) Assumption 3: The Back Spike has a slow component (long tail). narrow spike (3ms) spike with long tail (width 25 ms)
Back Spike with long tail (tail width 25ms) • Problems solved • Ca level in post-pre larger than at baseline. • Larger elevation of Ca in pre-post condition.
BPAP with wide tail Similar results: Karmarkar and Bunomano, 2002; Abarbanel et. al. 2003; Kitijima and Hara, 2000 (ms)
Nishiyama et. al. Nature, 2000 Bi and Poo J. Neurosci. 1998 Wittenberg and Wang, 2006 Froemke and Dan, 2005 Does the second LTD Window exist?
Frequency dependence of the STDP curve This occurs due to temporal integration of the calcium transients, and is not simply a consequence of the low frequency form of STDP. • Significance: • The (low frequency) STDP curve can not serve as a basis for STDP in general, let alone other forms of synaptic plasticity. • Stability of STDP depends on the small excess of LTD over LTP, this occurs only at low frequency.
STDP in Neocortex Thus, with different parameters our model can also account for neocortical STDP.
NMDA receptor dependent Calcium influx 0.7 0.5 0.0 NR2A+NR2B NMDA receptor kinetics NMDAR kinetics and subunit composition are plastic. Subunit composition, current duration and magnitude change during development and are activity dependent (Carmignoto and Vicini, 1992; Quinlan et. al. 1999, Philpot et. al. 2001)
Dependence of plasticity on NMDA receptor kinetics If is the magnitude of the fast component of the NMDA current. Large If fast current, and small integrated calcium influx We assume that the peak NMDAR current is constant (If + Is=1) Pairing induced Presynaptic rate induced If=0.25 (green) If=0.5 (blue) If=0.75 (red)
Dependence of plasticity on NMDA receptor kinetics If is the magnitude of the fast component of the NMDA current. Large If fast current, and small integrated calcium influx We assume that the peak NMDAR current is constant (If + Is=1) STDP If=0.25 (green) If=0.5 (blue) If=0.75 (red)
Froemke and Dan preliminary data (Soc. Neurosci. 2002)
I. CaDP- A simple theory that accounts for the induction of Calcium-dependent bidirectional synaptic plasticity. • II. Stochastic calcium transients affect the induction of plasticity with CaDP. • III. Receptive field formation with CaDP and metaplasticity.
Summary I: • A simple theory, with a small number of assumptions can account for the various induction paradigms • Major Assumptions: • Calcium control hypothesis • Calcium influx through NMDAR • Slow tail to the BPAP • Novel Consequences: • The width of LTD and magnitude of LTP correlate with the width of the BPAP tail. • A novel pre-post form of LTD. • Frequency dependence of STDP.
II. Stochastic Calcium transients effect the shape of plasticity curves. Up to now we have simulated numerically the calcium transients, disregarding the the effect of stochastic fluctuations. I. Analytical derivations: (a) A closed form solution of the mean calcium transients. (b) The variability of calcium transients due to a limited number of postsynaptic NMDA receptors II. Simulations of STDP plasticity curves with stochastic fluctuations of calcium transients. What happens to pre-post LTD?
Analytic calculation of the mean of calcium transients: Simplifying assumptions: (b) BPAP dynamics: Single Exponetial Component (a) NMDAR dynamics: Single Exponential Component BPAP 100 One component 80 Prob open Two components 60 t mV N 40 20 0 0 50 100 150 200 0 20 40 60 80 100 time (ms) t (ms) (c) Linear approximation to H(v) H(v) H(v) Linear approximation -60 -40 -20 0 20 V (mV)
Calcium influx: Formal Solution: According to our previous assumptions Ica(t) becomes a sum of exponentials (Yeung et. al 2004), and the integral can be solved.
Consequences of two component back spike Effect of the slow component of the back spike: Effect of Calcium time constant: 1.4 0.7 1.2 )/Ca (Ca -Ca 0.6 post|pre pre post|pre M) ] m 1 +2 Ca ] ( pre|post 0.5 +2 0.8 Ca post|pre 0.6 Peak [Ca Relative Peak [Ca 0.4 0.4 (Ca -Ca )/Ca pre|post post|pre pre|post Ca 0.3 pre 0.2 0 0.2 0 0.2 0.4 0.6 0.8 1 10 20 30 40 50 60 70 80 t I (ms) (no units) s Ca Slow component separates Capre from associative calcium signals A fast calcium time constant enhances the difference between post|pre and pre|post
Calculation of average calcium transients BPAP composed of one or two exponential components magnitude of slow component (ADP) magnitude of fast component Results two components 0.1 One component 0.6 t=10 Δ 0.08 t=-10 Δ 0.06 0.4 t τf M) M / ms) m τB N ] ( Pre only m +2 0.04 ( [Ca peak 0.2 +/- I 0.02 Two components τs 0 0 100 200 300 -50 0 50 100 150 200 D Time (ms) t (ms)
LTP LTD LTD LTD LTP Consequences for synaptic plasticity 0.1 .08 .06 t M / ms) t B N m .04 ( peak +/- I .02 0 -50 0 50 100 150 200 D t (ms)
Analysis of the variability of calcium dynamics, taking into account the stochastic properties of synaptic transmission: • Release of Glutamate is a stochastic process. 2. Opening and closing of NMDAR is a stochastic process
k1G u o k-1 Stochastic properties of NMDA receptors: u – unbound o – open + bound G- Glutamate A very simple 2 state Markov model (= 1 NMDAR time constant) τN=1/k-1 Other variables: M, number of NMDAR μ, average fraction of NMDAR that open as a result of one presynaptic AP The open probability has the form: Therefore the mean transients are:
Results: (assume number of NMDA receptors, is M=10) D t =10 ms D t =-10 ms D t =60 ms 5 mean(Ca) 4 [Ca] mean(Ca) mean(Ca) 3 m ( M) 2 std(Ca) std(Ca) std(Ca) 1 0 0 50 100 150 200 250 300 350 0 50 100 150 200 250 300 350 0 50 100 150 200 250 300 350 t (ms) t (ms) t (ms) CV=std/mean, at peak of Ca transient Number of NMDAR
Closed Bound 1 Open Bound 2 Desensitized 1 Markov model as in Lester and Jahr, (1992), Franks et. al. (2003). Results: For M= 10, τ =75 ms CV(60)/CV(-10)=1.5 Experimentally the number of NMDAR in spine is not well known. However there are estimates of ~10 (Racca et. al. 2000) Qualitatively confirmed in simulation using a Markov model of NMDA receptors
Calcium transients with and without ‘noise’ Presynaptic failures Postsynaptic variability of magnitude
Stochastic implementation CV – given there is release Distribution of Ca transients
Effect of noise on STDP curves M=20 M=10 2 a b 1.5 t W =15 ms 1 1 t =57 ms 0.5 - - - M=3200 M=40 2 1.5 W 1 0.5 - 150 150 50 150 150 50 0 50 0 50 - - - D D t (ms) t (ms) Shouval and Klantzis, J. Neurophys, 2005
Ω Ca Ca Why? 5 mean(Ca) 4 Δt=10 ms 3 Ca std(Ca) m ( M) 1 0 50 100 150 200 250 300 350 5 4 mean(Ca) 3 Ca Δt=-10 ms m ( M) Ω std(Ca) Ca 1 0 50 100 150 200 250 300 350 5 4 mean(Ca) 3 Δt=60 ms Ca Ω 2 std(Ca) m M) ( 1 0 0 50 100 150 200 250 300 350 t (ms)
II. Summary, stochastic analysis: • The NMDAR time constant controls the width of pre-post LTP, and the BPAP time constant controls post-pre LTD • The relative variability depends on the number of NMDAR at each spine, such that: CVM • Variability of calcium transients, for M small enough, reduces the magnitude of pre-post LTD more than of post-pre LTD • .