
DCCT: study design
DCCT: study design. Patients with type 1 diabetes (n = 1441). Secondary intervention (n = 715). Primary prevention (n = 726). Randomise. Randomise. Conventional. Intensive. Conventional. Intensive. DCCT: N Engl J Med 1993;329:977–86. Intensive group (n = 711):

DCCT: study design
E N D
Presentation Transcript
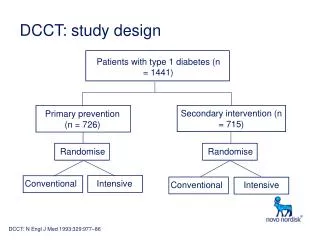
DCCT: study design Patients with type 1 diabetes (n = 1441) Secondary intervention (n = 715) Primary prevention (n = 726) Randomise Randomise Conventional Intensive Conventional Intensive DCCT: N Engl J Med 1993;329:977–86
Intensive group(n = 711): Aim: symptom-free + plasma glucose 3.9-6.7 mmol/L before meals, < 10 mmol/L after meals, > 4.0 mmol/l at 03.00 a.m. and HbA1c < 6.5% 3 insulin injections / day or insulin pump 4 daily blood glucose tests Hospitalisation for initiation Comprehensive education programme Frequent dietary instructions Monthly clinic visits Conventional group(n = 730): Aim: to avoid symptoms of hyper / hypoglycaemia 1 or 2 insulin injections per day Daily self-monitoring Initial diet and exercise education Quarterly visits DCCT: treatment conditions DCCT: N Engl J Med 1993;329:977–86
Conventional group encouraged to switch to intensive treatment Conventional 11 Intensive 10 9 HbA1c (%) 8 7 6 0 1 2 3 4 5 6 7 8 9 1 2 3 4 5 6 7 DCCT end DCCT EDIC Year DCCT: intensive therapy significantly reduces and maintains HbA1c Adapted from: N Engl J Med 1993;329:977–86, EDIC: JAMA 2002287:2563–9
Intensive 60 30 Conventional 40 20 20 10 0 0 0 2 4 6 8 10 0 2 4 6 8 10 DCCT: intensive therapy reduces microvascular complications Retinopathy: 76% reduction Microalbuminuria*: 34% reduction Patients (%) Patients (%) Years *urinary albumin excretion ≥40 mg per 24 hours Adapted from: N Engl J Med 1993;329:977–86
Risk of developing microalbuminuria Risk of retinopathy progression 16 16 12 12 Rate per 100 patient years Rate per 100 patient years 8 8 4 4 0 0 0 5 6 7 8 9 10 11 12 0 5 6 7 8 9 10 11 12 DCCT: microvascular complications increase as HbA1c increases HbA1c (%) DCCT: N Engl J Med 1993;329:977–86
0.4 DCCT Intensive DCCT Conventional 0.3 0.2 0.1 0 1 2 3 4 5 6 7 DCCT end Years of follow-up (EDIC) Retinopathy 7 years after the DCCT Cumulative incidence of retinopathy progression Adapted from: JAMA 2002287:2563–9
12 120 severe hypoglycaemia 10 8 6 60 risk of retinopathy 4 2 0 0 5.5 6 6.5 7 7.5 8 8.5 9 9.5 10 10.5 0 HbA1c (%) DCCT: the price of improved diabetic control – hypoglycaemia Rate pf progression of retinopathy (per 100 patient years) Rate of severe hypoglycaemia (per 100 patient years) Adapted from: N Engl J Med 1993;329:977–86
Economic analysis - DCCT • “From a health care system perspective, intensive therapy represents a good monetary value for the investment”1 • “Although intensive therapy is expensive, when the costs of complications are factored in, it becomes cost-effective for the treatment of type 1 diabetes”2 1. DCCT Research Group. JAMA 1996;276:1409-15 2. Herman WH, Eastman RC. Diabetes Care 1998;21(suppl 3):C19-24