Historical development of trade theory
150 likes | 414 Vues
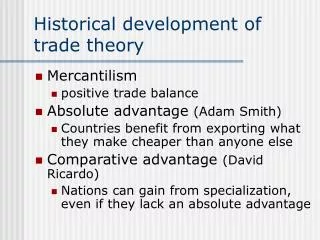
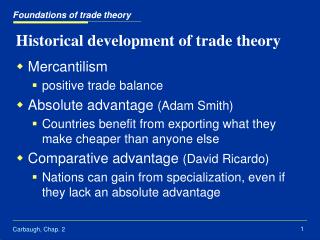
Foundations of trade theory. Historical development of trade theory. Mercantilism positive trade balance Absolute advantage (Adam Smith) Countries benefit from exporting what they make cheaper than anyone else Comparative advantage (David Ricardo)

Historical development of trade theory
E N D
Presentation Transcript
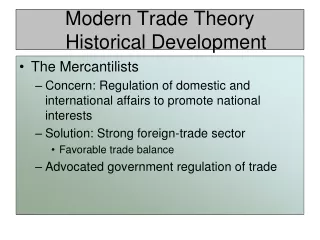
Foundations of trade theory Historical development of trade theory • Mercantilism • positive trade balance • Absolute advantage (Adam Smith) • Countries benefit from exporting what they make cheaper than anyone else • Comparative advantage (David Ricardo) • Nations can gain from specialization, even if they lack an absolute advantage Carbaugh, Chap. 2
Comparative advantage Absolute & Comparative Advantage Absolute advantage: each nation is more efficient in producing one good Output per labor hour Nation WineCloth United States 5 bottles 20 yards United Kingdom 15 bottles 10 yards Comparative advantage: the US has an absolute advantage in both goods Output per labor hour Nation WineCloth United States 40 bottles 40 yards United Kingdom 20 bottles 10 yards Carbaugh, Chap. 2
Comparative advantage Ricardo’s Comparative Advantage in money prices Cloth (yards) Wine (bottles) Nation LaborWage Quant. Price Quant. Price US 1 hr $20/hr 40 $0.50 40 $0.50 UK 1 hr £5/hr 10 £0.50 20 £0.25 UK 1 hr $8 10 $0.80 20 $0.40 (at $1.6 = £1) Carbaugh, Chap. 2
Comparative advantage Marginal Rate of Transformation A Slope = MRT = 0.5 B Wheat C Carbaugh, Chap. 2
Comparative advantage Production possibilities schedules: constant opportunity costs Slope = 2.0 = MRT Wheat Wheat Slope = 0.5 = MRT Carbaugh, Chap. 2
Comparative advantage Trading under constant opportunity costs Trading possibilities line (terms of trade 1:1) B’ Trading possibilities line (terms of trade 1:1) tt D’ C’ E Wheat Wheat A’ C A F tt B D Carbaugh, Chap. 2
Comparative advantage Production gains from specialization: constant opportunity costs Before After Net Gain Specialization Specialization (Loss) AutosWheat AutosWheatAutosWheat US 40 40 120 0 80 -40 Canada 40 80 0 160 -40 80 World 80 120 120 160 40 40 Carbaugh, Chap. 2
Comparative advantage Consumption gains from trade: constant opportunity costs Before After Net Gain Trade Trade (Loss) AutosWheat AutosWheatAutosWheat US 40 40 60 60 20 20 Canada 40 80 60 100 20 20 World 80 120 120 160 40 40 Carbaugh, Chap. 2
Comparative advantage Changing comparative advantage MRT = 0.67 Autos Autos MRT = 0.5 Carbaugh, Chap. 2
tt’ E D Comparative advantage Trade restrictions and gains from trade tt C A Crude oil B Carbaugh, Chap. 2
Increasing opportunity costs Production possibilities schedule under increasing costs Slope 1A = 1W A Slope 1A = 4W Wheat B Carbaugh, Chap. 2
Trading possibilities line C D B tt (1A =1W) Increasing opportunity costs Trading under increasing costs: US A tUS (1A = 0.33W) Wheat Carbaugh, Chap. 2
Trading possibilities line B’ C’ tt (1A =1W) D’ Increasing opportunity costs Trading under increasing costs: Canada tC (1A = 3W) Wheat A’ Carbaugh, Chap. 2