The Effect of Fertilizer Runoff on the Infectivity of T2 Bacteriophages
The Effect of Fertilizer Runoff on the Infectivity of T2 Bacteriophages. Luke Diorio-Toth Grade 10 Pittsburgh Central Catholic HS. Bacteriophages. Bacteriophages - Viruses that infect bacteria. Lytic Cycle. Phages’ Role in the Environment. Phages – may be very important to the environment

The Effect of Fertilizer Runoff on the Infectivity of T2 Bacteriophages
E N D
Presentation Transcript
The Effect of Fertilizer Runoff on the Infectivity of T2 Bacteriophages Luke Diorio-Toth Grade 10 Pittsburgh Central Catholic HS
Bacteriophages • Bacteriophages - Viruses that infect bacteria
Phages’ Role in the Environment • Phages – may be very important to the environment • There are more phages on earth than all other life forms combined • Extremely ubiquitous
T2 Phage • T2 Phages demonstrate host specificity (E. Coli) • T2 phages were one of the most important models in the early history of molecular biology.
Escherichia coli • Escherichia coli (E. coli) – very common, found in intestinal tract of most mammals • There are many strains of E. coli, most are non-pathogenic • Pathogenic strains can cause illness and death in humans • Frequently studied in biology – ubiquitous, simple structure, easily manipulated in the laboratory E. Coli
Dangers of Fertilizers • Eutrophication - an increase in chemical nutrients (usually nitrogen or phosphorus) in an ecosystem. • Can lead to excess plant growth – accelerates degradation of ecosystem • Disrupts normal functions in the ecosystem • Excessive fertilizer use – can be toxic to organisms. • Contain very small amount of harmful chemicals – magnified at high concentrations Potomic river estuary
Chemical Breakdown of Fertilizer • Total Nitrogen (N) = 10% • 1.6% ammoniacal nitrogen • 0.2% nitrate nitrogen • 8.2% urea nitrogen • Available Phosphate (P2O5) = 15% • Soluble Potash (K2O) = 10% • Iron (Fe) = 0.10% • 0.10% chelated iron • Manganese (Mn) = 0.05% • 0.05% chelated manganese • Zinc (Zn) = 0.05% • 0.05% chelated zinc • Derived from: urea, ammonium and potassium phosphates, potassium nitrate, iron EDTA, manganese EDTA and Zinc EDTA
Purpose • The purpose of this experiment was to determine if excess fertilizer could affect the infection rates of ground and water dwelling bacteriophages.
Hypotheses • All tested concentrations of fertilizer will significantly affect T2 phage infectivity. • Fertilizer Exposure time will not have a significant effect on T2 phage infectivity. • Null – Fertilizer will not significantly affect T2 phage infectivity.
Materials • 1 Magnetic Stirrer • 1 Fine Tip Permanent Marker • Klett Spectrophotometer • LB media • Sterile water • E. Coli B culture • T2 Bacteriophage culture • Shultz Liquid Fertilizer • Distilled water • Top Agar • 30 Petri Dishes poured with LB agar • 30 15mL Sterile Polystyrene Conicals tubes • 5 50mL Sterile Polystyrene Conicals • 10 Sterile Microtubes • 1 Micropipette with Sterile Tips • Sterile Dilution Fluid (SDF) • 1 Plastic Tub • 1 Thermometer • 1 Tube Rack • 1 Macropipette with sterile tips SDF (per 1 liter) 100mM KH2PO4 100mM K2HPO4 10mM MgSO4 1mM NaCl LB Media (per 1 liter) 10g Tryptone (1%) 5g Yeast Extract (0.5%) 10g NaCl (1%) 2 mL 1N NaOH Top Agar (per 1 liter) 10g Tryptone (1%) 3g Peptone (0.3%) 5g NaCl (0.5%) 5g Agar (0.5%)
Procedure A culture of T2 phages was prepared in a tube with a phage density of 107 phages/mL The phage suspension was reduced to a density of 105 phages/mL by adding 0.1mL of the phage to 9.9mL of Sterile Dilution Fluid (SDF). 0.01mL of the reduced phage was added to 9.99mL of SDF to create a T2 phage stock solution with a suspension of 104 phages/mL. A culture of E. coli B was prepared in LB media. After 24 hours in the incubator, 1 mL of the culture was transferred to 50 mL of LB media in a sterile 250-mL sidearm flask. The flask was placed in a shaking water bath until the culture was in mid-log phase (about 100-150 Klett units) Sterile plates poured with LB agar were pre-warmed in an incubator set at 37° C A stock solution of liquid fertilizer was prepared in a flask with a concentration 10 times the manufacturers suggested concentration. The fertilizer solution was then sterile filtered into a 50mL sterile polystyrene conical.
Procedure (part 2) • 5 sterile microtubes were then placed in a rack and filled with the fertilizer stock, phage stock, and sterile water to create the desired concentrations: • The tubes were set aside for 30 min. • Process was repeated with a second set of microtubes. • These tubes were set aside for 45 min.
Standard Overlay Technique for Phage Plating • A 45° hot water bath was prepared in a plastic tub. • A tube rack was placed in the bath, and 3 (for each concentration, 15 total) 15mL sterile polystyrene were placed in the rack. • 3 mL of liquefied top agar was added to each conical. • 0.1 mL of 30 min. phage suspension and 0.3 mL of mid-log phase E. coli B was added to each conical. • The tubes were then briefly vortexed and the contents poured onto pre-warmed LB agar plates. • This process was repeated with the 45. min phage. • After setting, all plates were incubated at 37°C for 24 hours, and then the resulting plaques were counted.
▲Hot water bath ▲Microtubes and pipettes ◄Plaques
Plaque Counts 30 Minutes 45 Minutes
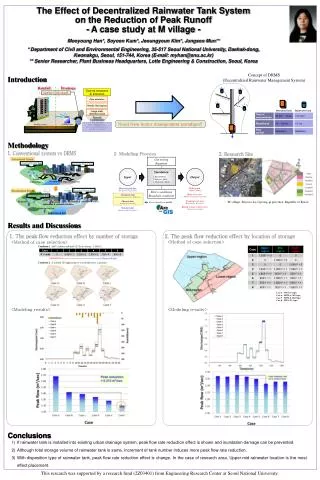
The Effect of Fertilizer Exposure Time on T2 Phage Infectivity Sig Sig Sig Not Sig Sig
Conclusions • All tested concentrations of fertilizer will significantly affect T2 phage infectivity. - Accepted • Fertilizer Exposure time will not have a significant effect on T2 phage infectivity. – Rejected, except for 2x fertilizer concentration • Null – Fertilizer will not significantly affect T2 phage infectivity. - Rejected
Conclusions (Limitations/Extensions) • There was a lag between the time tubes were filled with top agar, and when they were poured. During this time, the agar could have cooled, and started to congeal early, making counting plaques more difficult. This could be remedied by having a team of students working together to speed up operations. • Additional sets of microtubes will be prepared, and more plates will be poured to increase accuracy of the ANOVA. • Different phage and host will be tested. • New experiment will be designed to test if fertilizer affected the host, rather than the phage. • Testing longer times of exposure may reveal new findings • Testing higher concentrations may reveal new findings.
References • Dr. John Wilson, University of Pittsburgh, Biostatistician • http://en.wikipedia.org/wiki/Fertilizer • http://en.wikipedia.org/wiki/Eutrophication • http://www.starnursery.com/show_details.php?root=2&sub1=28&product=522&PHPSESSID=01be5cdfbfca1a322d7e21555fa62f8e • http://www.schultz.com/ • http://www.oregontoxics.org/monk.html • http://epa.gov/ • http://en.wikipedia.org/wiki/Phage • http://en.wikipedia.org/wiki/Biosphere • http://en.wikipedia.org/wiki/Phage_ecology • http://en.wikipedia.org/wiki/ANOVA • http://www.des.state.nh.us/factsheets/bb/bb-3.htm • http://www.ppath.cas.psu.edu/extension/plant_disease/overfer.html • http://www.usc.edu/CSSF/History/2004/Projects/J0921.pdf • http://pubs.usgs.gov/of/1998/of98-805/lessons/chpt6/act2.htm