Understanding Chronic Homelessness Patterns: Inflow, Outflow, and Utilization
220 likes | 243 Vues
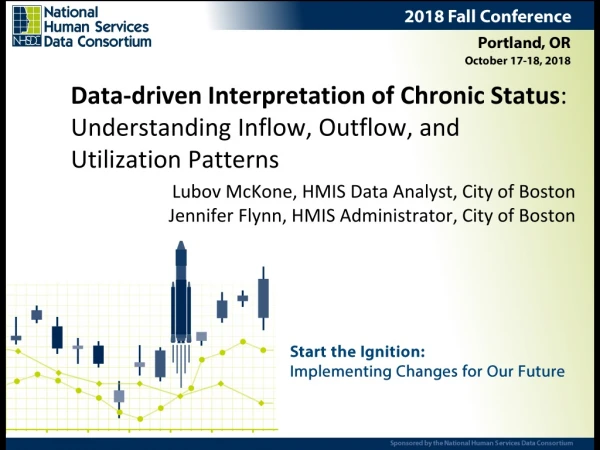
This study analyzes the data-driven interpretation of chronic homelessness in the City of Boston, focusing on inflow, outflow, and utilization patterns. It explores the effectiveness of the city's initiatives in ending veteran and chronic homelessness and identifies areas for improvement.

Understanding Chronic Homelessness Patterns: Inflow, Outflow, and Utilization
E N D
Presentation Transcript
Data-driven Interpretation of Chronic Status: Understanding Inflow, Outflow, and Utilization Patterns Lubov McKone, HMIS Data Analyst, City of Boston Jennifer Flynn, HMIS Administrator, City of Boston
City of Boston Background • Within the City’s CoC 2017-2018: • 10,080 Single Adults in ES Annually • 1,800 on any given night • 493 Chronically Homeless single adults on By Name List • 270 Veterans PIT Count • 1,715 Families in ES Annually • 1,075 on any given night • 104 Chronically homeless households • 5 Veterans PIT Count • 9 HMIS Software installations • 30+ Service Provider Agencies using HMIS • 700+ Users • 98% ES Bed Coverage • Street Outreach in HMIS
Boston’s Way Home: An Action Plan to End Veteran and Chronic Homelessness in Boston 2015-2018 • End Veteran homelessness by the end of 2015 • End Chronic homelessness by 2018 • System Transformation Investments Made in: • Front Door Triage • Rapid Re-Housing $1.8M City investment • PSH Development both “Brick & Mortar” and partnerships especially with Boston Housing Authority • Technology $400,000 City investment Open Source HMIS Data Warehouse Open Source Coordinated Access Housing Matching System
Boston Technology Systems 2015 - Coordinated Access System (CAS) Coordinated Entry for Chronic into CoC PSH programs Prioritization Order • On the Chronic Homeless By Name List produced from HMIS • First Date Homeless in Boston • CAS matches eligible clients from the BNL based on HMIS data to a vacancy and sends referral to highest ranked based on 1st date in system
Boston’s Way Home Progress • The Good News • January 2016 certified by USICH as Ending Chronic Veterans Homelessness • Fewer than 5 veterans sleep on the street any given night and are offered shelter and services nightly • Reduced overall Veteran homelessness by 45% in 2 years • Boston has decreased Chronic Homelessness by 20% between 2016-2018 • The Bad News • Plan started with 612 Chronically Homeless Individuals on the By Name List • 514 Chronically Homeless have been housed during the plan ending 3,300 years of homelessness • In February 2018, 493 individuals are still Chronically Homeless in Boston • 20% of the current BNL is newly Chronic • Total Inflow of 840 Chronic Individuals between 2016-2018
Chronic Homeless in Boston As an large metro city Boston receives inflow from all over MA and New England. Boston shares borders and transit lines with 5 other CoCs. Due to HUD System Performance Measures focusing on HMIS data and length of stay, Boston had to narrow our priority to those who were using our system the most. We thought we were with 1st Date Priority
HUD’s definition of Chronic Homelessness: • Lives in a place not meant for human habitation, a safe haven, or in an emergency shelter; and, • Has been homeless and living as described in paragraph (1)(i) of this definition continuously for at least 12 months [one year] or on at least 4 separate occasions in the last 3 years,[where each homeless occasion was at least 15 days] as long as the combined occasions equal at least 12 months and each break in homelessness separating the occasions included at least 7 consecutive nights of not living as described in paragraph (1)(i). Stays in institutional care facilities for fewer than 90 days will not constitute a break in homelessness, but rather such stays are included in the 12-month total, as long as the individual was living or residing in a place not meant for human habitation, a safe haven, or an emergency shelter immediately before entering the institutional care facility; • An individual who has been residing in an institutional care facility, including a jail, substance abuse or mental health treatment facility, hospital, or other similar facility, for fewer than 90 days and met all of the criteria in paragraph (1) of this definition, before entering that facility; or • A family with an adult head of household (or if there is no adult in the family, a minor head of household) who meets all of the criteria in paragraph (1) or (2) of this definition, including a family whose composition has fluctuated while the head of household has been homeless. A “homeless individual with a disability,” as defined in section 401(9) of theMcKinney-Vento Homeless Assistance Act (42 U.S.C. 11360(9)), who:
Data warehouse reports • “Chronic list” run automatically on the 1st and 15th of every month • Can be run ad-hoc anytime
How are these lists used? • To house people • February 1st and August 1st lists become “cohorts” – groups of clients eligible for Permanent Supportive Housing through our Coordinated Access System • Checked and edited by hand • For data analysis • To help us better understand chronic homelessness
How can we analyze these lists to better understand chronic homelessness?
Trends, inflow, and outflow – the nitty gritty • Data reshaping with the R tidyverse • Data structure is client-centric - each row represents a client • Transforms chronic lists into a matrix showing which clients met the chronic definition in a given month (1 = met the definition, 0 = did not) • Opens doors to analyzing patterns of when and how clients meet the chronic definition
Inflow The amount of clients that are becoming chronic for the first time is increasing Many clients bounce between meeting the definition and not meeting the definition
Outflow We can compare inflow and outflow, although we have to be careful
Creating typologies of chronic homelessness • Need to be able to compare individuals’ chronic histories • Cohort methodology • We “trim” and align the chronic histories of individuals to the two years after their first date meeting the definition so that we can more accurately compare them. • R package stringr can detect and analyze patterns in our strings of 1s and 0s
Creating typologies of chronic homelessness • Using the data we reshaped using the cohort methodology • We used longitudinal data analysis to cluster clients with similar chronic history • Optimal matching, dissimilarity matrix, hierarchical clustering • R package TraMineR
Evaluating current prioritization First year homeless is not a predictor of cumulative days homeless Clusters do a better job of predicting cumulative days homeless, regardless of first year homeless
What we know • Inflow into chronic homelessness is increasing • Different individuals have different patterns / frequencies of meeting the chronic definition • The largest subgroup meets the definition sporadically and for short periods of time How can we use these insights to inform policy?
Translating analysis into policy • At a time when other cities are seeing an increase in chronic homelessness - a 12% increase nationally from 2016 to 2017 - Boston has reduced it by 20% from 2016 to 2018 • We have housed more than 530 chronically homeless individuals during the initiative, representing more than 3,300 years of homelessness ended • We aren’t as close to 0 chronically homeless individuals as expected because the inflow into chronic homelessness far outpaces what we modeled with the data we had available in 2015 • More than 50% of individuals on the current chronic list have never been on any of the City’s by-name chronic lists before • Each year, an average of 455 new individuals become chronically homeless in Boston • Each year, we house an average of 247 chronically homeless individuals
Translating analysis into policy • When we started the initiative, our target population was anyone who met the federal definition of chronic homelessness. We learned many of these people are moving targets. • 37% are chronically homeless for only 6 months or less • On the City’s curren by-name chronic list, 2 in 5 (42%) individuals spent fewer than half of the last 3 years in Boston • We have developed a more sophisticated understanding of chronic homelessness and continue to refine our strategies and the way we target our resources • Chronically homeless individuals are prioritized for housing based on cumulative days homeless rather than first date homeless • Rapid rehousing resources are now being deployed to more effectively prevent chronic homelessness rather than sering people who have been homeless for short periods of time