Download
1 / 51
510 likes | 537 Vues
This report explores the efficiency of data presentation and utilization in state soybean variety trials. It discusses the methods used for data collection, analysis, and presentation, as well as the utilization of this data in variety selection and research. The report also highlights the benefits of utilizing a database for soybean variety trials.

E N D
Efficiency of data presentation & utilization in state soybean variety trials Lingxiao (Ling) Zhang Delta Research and Extension Center Mississippi State University Tampa, FL. 01-28-2010
State Soybean Variety Test Procedures Recommendations OVT Group Producers Seed company Uni. researcher Extension agent Find locations & cooperators Result Report Variety collection Data analysis Experimental design Data collection Harvest Preparation Planting
Hard copy Report Methods for OVT • Field Day • Internet • htm • pdf • - xls • - database
SOYVA 2009 - Soybean Variety Selection Program (SOYVA) is a computerized soybean variety selection program (U-AR).
Database Modeling Information system Internet Data Utilization from OVT Deltasoy An Internet-base soybean variety trial database for research, extension and production
Diagram of a three-tier of architecture of a Web-based database
Entity relationship diagram of parameters in Deltasoy database.
A database for national soybean OVT? Soyrus Soy-r-us
Who gets benefit from Soyrus? • Crop grower • Seed company • Private consultant • County agent • University researcher
How can a database help? • Multi-year • Multi-location • Comparing different Variety or systems • Add more function for analysis (weighted) • Vt = (a) P1 + (b) P2 + (c) P3 + … • Long-term data accumulation • Initial other research topics
Modify Soybean MG Adaptation Zones (Scott and Aldrich, 1970)
Test site distribution of OVT MI IL SD MS
Materials and Methods • Data sources - State soybean variety trials - All soybean producing states Data criteria - Most of irrigated test - Yield over 45 bu/A (3030 kg/h) - 30 varieties or more in a test - Planting date within certain range
Map construction (Locations selected for creating adaptive zones of soybean MG in the USA)
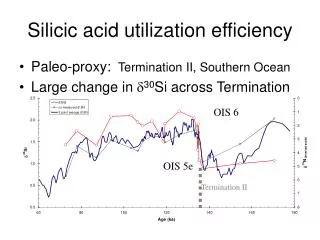
Zones of optimum soybean maturity groups for maximum yield in the US (Figure was created by the Kriging interpolation method using variety trial data from 1998 to 2003 )
Modified zone of optimum soybean maturity groups for maximum yield in the US
Application of OVT data • Growth stage and maturity prediction at all location? • Data source – latitude, PD & MD • Method – modeling (regression, ANN, etc.)
Potential researchable topics using an OVT database • * Yield trend? • - historical data may tell real genetic gain? • * Environmental effects on yield? • G x E • Soil type, • Irrigation, disease, insect • * Protein & oil content? • Type of variety • Year trend under diff. envion. conditions
Major Problems • Funding - USB ? - Other agents? • Need action • Form a committee • Different focuses for each state • - Focus on the similarity
Parameters in database Common Variety name MG (RM) Yield Plant height Maturity Date Location Irri. vs. N-iir. Conv. vs. RR (Planting Date) ….. May be Varied Shattering score Lodging score Protein content Oil content ….. Genetic controlled Flower& Pod Pubescence Disease …..
Other Problems • Update information? • - Variety turn over past • - Disease resistance • Website/Server maintenance • Web submission • Other
Thank You ! Question?
Comparison summary • The adaptive zone for one MG is about 3-4 degrees latitude, wider than it was suggested, especially for mid-late MGs (>III) in the south. • VI is the latest MG adapted in the US for the optimum yield, and MG VII-VIII are not optimum MGs for the US (if not count FL) 00- • Late maturity (VI) soybeans adapted to East coast rather than the Midsouth due to available late precipitation.
Recent Soybean Variety Turn-over Ratio Data source: popular conventional and roundup ready soybean varieties collected by NCST (n=245)
Zones and planting date divided for soybean producing states involved in MG map construction
Materials and Methods (cont.) • Determination of the values of optimum maturity groups - regression method: yield vs. MG - maximum yield weighted average