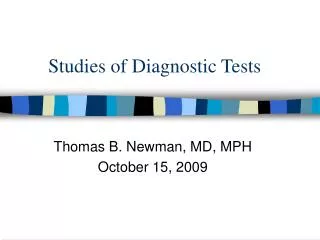

Diagnostic Studies: Sensitivity, Specificity, and More for Accurate Healthcare Decisions
E N D
Presentation Transcript
Diagnostic studies Adrian Boyle
Diagnostic studies: objectives • Sensitivity • Specificity • Positive and negative predictive values • Accuracy • Likelihood ratios • Receiver Operator Curves
Diagnostic studies: design • Cross sectional comparison to a gold standard • Cohort study • RCT • That’s the way we’ve always done it
Basics Sensitivity A/A+C True positive How good is this test at picking up disease? SNNOUT A SeNsitive test which is Negative effectively rules OUT a diagnosis
Specificity D/B+D True negative How good is this test at excluding the well? SpPin A SPecific test which is Positive rules a case IN
Basics PPV A/A+B Post +ve test prob • If a patient has a +ve test what is the probablity that they have the disease
Basics NPV D/C+D Post test prob of –ve test If a patient has a negative test, the probablity that they do not have the condition
Advanced Accuracy A+D/A+B+C+D What proportion of all tests have given the correct result?
Exercise: D-dimer in pleuritic chest pain and SOB with active cancer
Sensitivity Specificity PPV NPV 99% 38% 28% 99% Example
Sensitivity Specificity PPV NPV 90% 38% 1.2% 99% Example
Advanced • Receiver (Relative) Operator Curves for continuous data • Plot the Sensitivity (y axis) against the false positive rate, 1-Specificity (x-axis) • A good test has the greatest area under the curve • These curves are used to decide where to make the cut-off
Advanced • Likelihood ratio of a positive test (LR+ve) • Sensitivity / 1-Specificity • How much more likely is a positive result to be found in a patient with, as opposed to without, the condition? • 1 to an infinitely big number
Advanced • Likelihood ratio of a negative test • 1-Sensitivity/ Specificity • How much more likely is a negative test in a patient with, as opposed to without, the target disorder • 1 to an infinitely small number
Example (Fictitious) A 55 year old man presents with headache. You are concerned about temporal arteritis You know that the prevalence of TA in this age group with headache is 5%. (PRETEST PROBALITY) The LR+ve of an ESR >60 is 6.9 for diagnosing TA
Specific things to look for 95% Confidence intervals especially lower limit Sensitivity 94% (95% CI 65-100%) Sensitivity 92% (95% CI 89-95%)
Example 2 0.05 x 6.9 = 0.345 If this man has a raised ESR then his chances of having temporal arteritis are 34%
Example 3 The LR-ve of an ESR in this condition is 0.6 0.05 x 0.6 = 0.03 If this man has a normal ESR, then his chances of having TA are 3%
Use of LR • A positive LR test > 5.0 is pretty useful at diagnosing something • A negative LR <0.02 s pretty good at ruling something out
Particular biases : spectrum • BNP story • Is there any selection in this group who might have systematic differences to my patients? • Case Control Design leads to Spectrum Bias
Particular biases : work-up bias • (Verification bias) • Patients with suspected coronary artery disease and positive exercise tests were more likely to undergo coronary angiography (the reference standard) than those with negative exercise tests.
Other biases Incorporation bias Test is also part of the gold standard
STARD • STAndards for the Reporting of Diagnostic Accuracy studies
Biases to be aware of Spectrum bias is the study population exaggerated into yes / no groups Partial verification bias Gold standard applied inconsistently to confirm negative results Incorporation bias Test is also part of the gold standard
Quick list for appraising a paper • Identify aims • Identify study design • Identify population, exposure and outcome • Consider the gold standard • Consider the measurement • What biases (work up, expectation) are there? • What is the result and what does it mean
Useful resources BMJ debate paper about test characteristics http://bmj.bmjjournals.com/cgi/content/full/329/7459/209?maxtoshow=&HITS=10&hits=10&RESULTFORMAT=&fulltext=snnout&andorexactfulltext=and&searchid=1115988869897_7738&stored_search=&FIRSTINDEX=0&sortspec=relevance&resourcetype=1