Download
1 / 9
90 likes | 114 Vues
Explore the Q1 2017 retail performance trends, focusing on brick-and-mortar stores and key categories. Discover insights on sales, metrics, and comparison for January, February, and March. Learn strategic advertising and new media approach suggestions to boost store traffic and engagement in the evolving retail landscape.

E N D
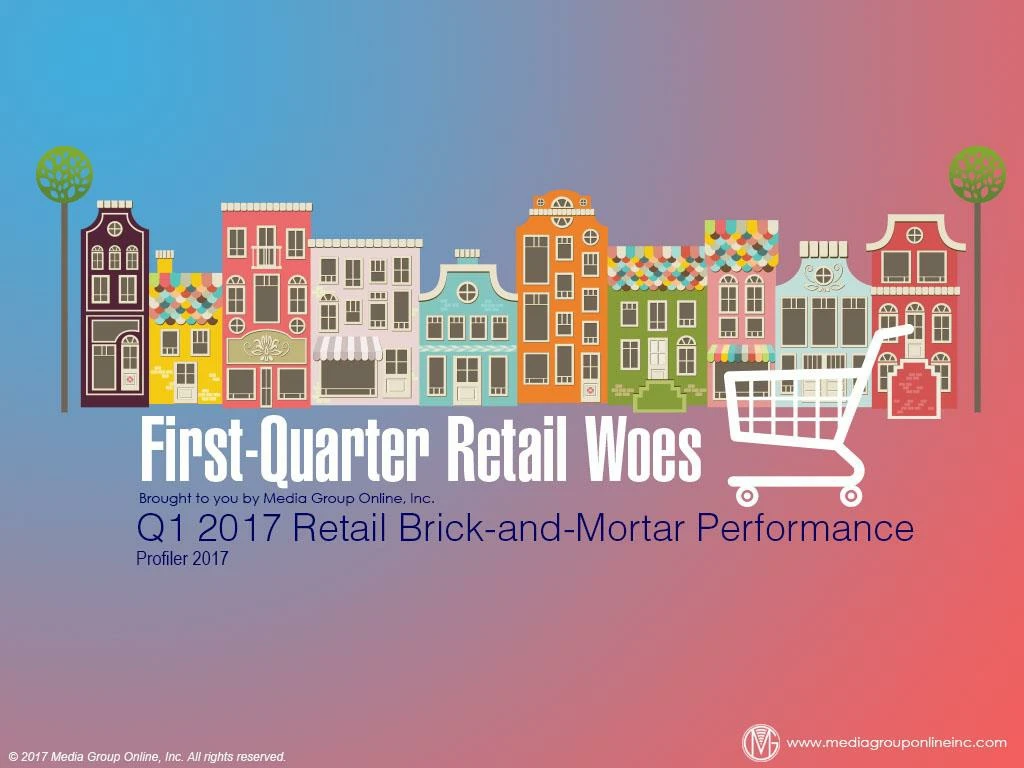
All of Retail Looks Good • In this special Profiler, Media Group Online shares in-depth data from RetailNext about brick-and-mortar retail stores’ performance during Q1 2017. • Most of the economic signs – employment, consumer and business confidence, etc. as well as the election of a new president that many thought would be a boost to the economy – were positive enough to drive an increase in retail sales during Q1. • As the table on page 1 of the Profiler clearly indicates, the four categories the US Census Bureau uses to measure and report retail sales increased much more from Q1 2016 to Q1 2017 than from Q1 2015 to Q1 2016.
It’s the Brick-and-Mortar Stores That Are Suffering • As Media Group Online and virtually all other media outlets have reported, it isn’t overall retail sales where the problem lies, but among brick-and-mortar stores, and in specific categories. • According to US Census Bureau data, Q1 2017 retail sales declined, compared to Q1 2016, at electronics/appliances stores, -2.3%; pharmacies/drug stores, -1.0%; sporting goods, hobby, book and music stores, -2.2%; and department stores, -4.4%. • With negative Q1 2017 sales for so many retail store categories, it was the categories, non-store retailers, +12.1%, and electronic shopping and mail order houses, +13.3%, which were the primary contributors to the 5.1% increase in Q1 2017 retail sales.
January Started the Year on a Sour Note • Every month, RetailNext publishes its Retail Performance Pulse report that provides a deeper look into how brick-and-mortar stores performed, based on 7 different metrics. (See page 2 of Profiler for comparison of January 2017 and December 2016.) • The report also includes the high and low days of the month in each category. During January, for example, Saturday, January 28th had the highest sales and CVR. The low point for sales was Tuesday, January 17. • Because January was the mildest January since 2011, the Northeast had a better sales metric (although it was -6.7%) than the Midwest, -9.8%, and the South, -11.7%, but the West sales were -4.4% and its CVR, ATV and SY were all positive.
February Was the Low Point of the Quarter • Typically, brick-and-mortar retailers expect a sales bump from Valentine’s Day, but the first two weeks of February registered double-digit negative numbers, or -14.6% for the first week and -33.5% for the second week, in net sales. • Valentine’s Day being on a Tuesday didn’t help much, but February’s week 3 was positive in transactions, +3.5%, and net sales, +3.8%; however, ATV was -0.3%. Saturday, February 11 was the highest in sales and transactions. • Except for conversions, at +0.3%, February performed worse than January in the other six metrics, especially sales, traffic and transactions. (See the table at the bottom of page 2 of the Profiler.)
March’s Improvement Was Welcomed • March’s performance was a significant improvement compared to January and February. Although sales, at -8.1%, and traffic, at -9.2%, were still in the red, those were the lowest declines in sales and traffic since November 2016. • ATV, at +2.1%, and SY, at +1.1%, were in positive territory for the first time since December 2016. • Weather appeared to have had an effect during March, as it was the coldest since 2014, especially in the Northeast and Midwest, while it was warmer in the South compared to March 2016, and the Pacific coast had less precipitation.
Advertising Strategies • As a media consultant, share this Profiler with your prospects and clients to use as benchmarks against which to measure their performance. If they are not gathering, tabulating and analyzing these numbers for their store, then encourage them to do so. • Some of your prospects and clients may want to consider a monthly or quarterly “pop-up” location at, for example, a mall or shopping center well outside the metro area to reach consumers who probably wouldn’t travel to the retailer’s regular location. • Increasing store traffic will generally lift all the other RetailNext performance metrics, so help your prospects and clients develop some events and experiences that will appeal to their target audience.
New Media Strategies • Conduct a poll with an email or social media campaign, asking customers and visitors what they would like to see or experience in the store that would increase their visits. If you adopt any of these suggestions, then promote the fact on social media. • Engagement with store employees can generate more loyalty and store traffic, so retailers should record videos of each employee, with the primary message explaining their position at the store and a specific problem they can help customers solve. • Hire a personality to do “man-on-the-street” interviews on camera. Approach shoppers on a street or in a mall and invite them to visit the store. Incentivize them with a free lunch. Ask them on camera what they found at the store that they didn’t think was offered there.