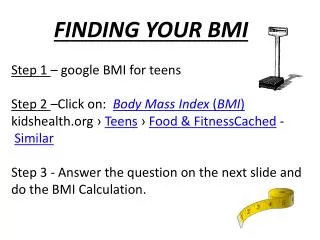
BMI:
Learn about Body Mass Index (BMI), a tool indicating weight status correlated with body fat, risks, and how to calculate BMI for adults and children.

BMI:
E N D
Presentation Transcript
BMI: Body Mass Index
The term BMI is often used when discussing the obesity epidemic, but what is BMI?
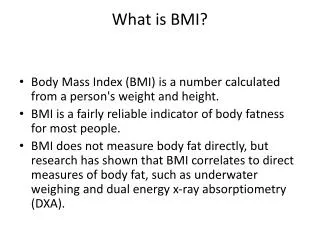
BMI is a tool for indicating weight status. It is a number that shows body weight adjusted for height.
BMI correlates with body fat. The relation between fatness and BMI differs with age and gender. • For example, women are more likely to have a higher percent of body fat than men for the same BMI. • On average, older people may have more body fat than younger adults with the same BMI.
BMI is a tool for indicating weight status. It is a number that shows body weight adjusted for height. BMI can be calculated with simple math or by charting height and weight.
BMI is a screening tool used to identify individuals who are underweight or overweight. BMI is NOT a diagnostic tool.
How Does BMI Relate to Health? The BMI ranges are based on the effect body weight has on disease and death. As BMI increases, the risk for some disease increases. Some common conditions related to overweight and obesity include: Premature death Cardiovascular disease High blood pressure Osteoarthritis Some cancers Diabetes
BMI Charts The BMI chart is not for babies, children, teens, pregnant or breast feeding women, adults over 65 years old, very muscular people and endurance athletes such as runners.
Calculating BMI • BMI can be calculated with simple math or by charting height and weight. BMI
On the BMI Chart • Find your height (in inches). • Find your weight (in pounds). • Your BMI is the point on the graph where your height and weight meet.
For example, a person who weighs 220 pounds and is 6 feet 3 inches tall has a BMI of 27.5.
Above a Healthy Weight • If your BMI lies above the normal area, then you may be at greater risk for health problems such as high blood pressure, heart disease, diabetes, and certain cancers.
Below a Healthy Weight • If your BMI lies below the normal area, then you may be at risk for health problems such as irregular heart rhythms, depression, anemia, and osteoporosis. • Some people have a low BMI, but are eating well and have lots of energy. The best advice for people below a healthy weight is to be aware of their health risks and maintain a stable weight by eating well and keeping active.
These men have the same height, weight, and BMI, but may have different percent body fat.
BMI is only one of many factors used to predict risk for disease. It is important to remember that weight is only one factor related to disease.
BMI is the not the only indicator for health risk Other Factors That Are Important When Calculating Health Risk Include: • Diet • Physical Activity • Waist Circumference • Blood Pressure • Blood Sugar Level • Cholesterol Level • Family History of disease
BMI-for-age is plotted on gender specific growth charts. These charts are used for children and teens 2 – 20 years of age. BMI in Children
BMI in Children • BMI-for-age is plotted on gender specific growth charts. • These charts are used for children and teens 2 – 20 years of age.
BMI is Used Differently with Children Than it is With Adults • In children and teens, body mass index is used to assess underweight, overweight, and risk for overweight. • BMI for children, also referred to as BMI-for-age, is gender and age specific.
A child who is relatively heavy may have a high BMI for his or her age. To determine whether the child has excess fat, further assessment would be needed. To determine a counseling strategy, assessments of diet, health, and physical activity are needed.
Each of the CDC BMI-for-age gender specific charts contains a series of curved lines indicating specific percentiles. Healthcare professionals use established percentile cutoff points to identify underweight and overweight in children.
BMI in Children Underweight: BMI-for-age < 5th percentile At risk of overweight: BMI-for-age 85th percentile to < 95th percentile Overweight: BMI-for-age > 95th percentile
What does it mean if my child is in the 60th percentile? The 60th percentile means that compared to children of the same gender and age, 60% have a lower BMI.