Download
1 / 48
480 likes | 510 Vues
Explore powerful data analysis methods to inform educational decision-making at various levels. Presentation covers growth models, utilization-focused information, formative and summative assessments, and educational performance metrics.

E N D
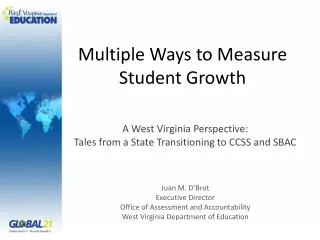
NEW AND POWERFUL WAYS TO MEASURE LEARNING A Presentation to MSBA/MASA Annual Conference Bill Elder and Howard Jones Office of Social and Economic Data Analysis University of Missouri October 22, 2010
SESSION GOALS • Explore the power of data to inform instructionally relevant decisions – Getting focused. • Explore different ways of looking at student performance to view progress over time at the district, school, class and individual student levels – “Growth Models”
Http://WWW.OSEDA.MISSOURI.EDU Office of Social and Economic Data Analysis University of Missouri • Data • Information • Knowledge • Wisdom “The construction of knowledge involves more the orderly loss of information than it’s meaningless accumulation.” -- Kenneth Boulding
OSEDA Mission: Collaborate with partners to conduct analysis that contributes to improvements in the health, education and well-being of people and communities in Missouri and the world.
Utilization Focused Information “Answers” are “useful” when they reduce the risks of making the wrong decision. To know you have asked the “right” questions and produced “useful” answers….focus on decision makers and decision-making ….. In particular… Instructional decision-making …. Governance, Administration, Teachers Parents and Students
Formative “Improve” Periodic and timely Focus on program activities and outputs Leads to early recommendations for program improvement Summative “Prove” Were resources committed worthwhile? Focus on outcomes and impact Measures value of program based on impact Educational Decision-Making
“Summative” Result Choosing and Getting to Port (Where we’re going) Plotting a Course (Making a plan) Estimating Position (Where we might be) Taking a “FIX” (where we really are) “Set and Drift” Adjusting Course “Formative” Information
Challenging Times…. The MSIP Educational Framework Resources Processes Performance Demographic Context
Challenging Times…. Resources
Quick Review of Demographics Total Population 2009 World: 6.8 Billion U.S.: 307 Million Mo.: 5,987,580 U.S. Increase 9% Missouri 7% Six States account for 55% * * * * * *
Diverse Trends: Regions within Regions – and within urban areas
New Census Estimates On the Brink of New Data • New American Community Survey • New (5 year) ACS in December • New 2010 counts in December • Be careful with small areas • Plus and Minus of Estimates is large
Process Indicators The Advance Questionnaire (AQ) • Perceptual data obtained through a questionnaire(s) • Provides a voice for all key stakeholder groups • Includes questions based on critical research-based elements • Allows development of additive scales consistent with Effective Schools Research
Selected Additive Scales/Definitions • Leadership: This scale identifies the degree to which leadership is perceived as effective in improving student learning. • School Climate: This scale identifies the degree to which all students feel respected and valued. • Efficacy and Expectations: This scale identifies the degree to which teachers and students believe that they are capable of impacting student achievement.
Efficacy/Expectations Scale(Faculty) • There are effective supports in place to assist students who are in jeopardy of academic failure. • I emphasize the importance of effort with students. • I have the skills necessary to meet the needs of all learners in my classroom. • I believe that I can positively impact student performance.
FACULTY:Efficacy & expectations explains 10.9% of the variance in communication arts achievement
STUDENTS: Efficacy & expectations explains 17.2% of the variance in communication arts achievement
CLASSROOM OBSERVATION TOOL • Provides a means to maintain a longitudinal record of prevailing instructional practice • Provides a means to look at instructional practice by subject area, grade level, school, etc. • Provides a means to examine instructional leadership within each school
Educational PerformanceStudent Growth ModelsStudentGrowth Percentiles
PERFORMANCE DATA • Annual Performance Report (APR) • APR and AYP disaggregated by gender, race, free and reduced lunch, etc. • MAP/EOC Results • Benchmark or Common Assessments • Student Growth Data
Growth Models Explored to Date • Missouri AYP “Increment” Model • Student Growth Percentiles using R (SGP) • Hierarchical Linear Models (HLM) • Ordinary Square Regression (OLS) • Mixed Models All of these have advantages depending on the question and the audience
All Models are Highly Correlated Spearman’s Rho Correlations of Growth Percentiles among Growth Models Data: MAP 2006-2008 Communication Arts, Cohort Grade 5 in 2008 (N=56,231) Note. SGP = Student Growth Percentile; HLM = Hierarchical Linear Modeling; OLS = Ordinary Least Squares.
What is a Student Growth Percentile (SGP)? • A student’s progress compared to other students with similar MAP score history • A student’s growth percentile indicates the percentage of students, starting at the same place, that the student’s growth exceeded • Typical growth is equal to 50th percentile • Similar to pediatric growth charts
Questions Answeredby Growth Model • How much growth did a child make in one year? (What is?) • How much growth is enough to reach proficient or advanced? (What should be?) • How much growth is the best in Missouri (What could be?)
A growth plan for every student Expanding to include more current Benchmark and Authentic Assessment
What is Next --Pilots • Explore Various Types of Growth Models • Explore Student Growth Percentiles to Inform Instructional Decision-making • Explore Practical Data Visualization Options for Student Growth Percentiles • Missouri Pilot Project 2010-2011 • Include Benchmark and Local Assessments
COLORADO GROWTH MODEL RESOURCES http://www.schoolview.org/learningcenter.asp
CONCLUDING THOUGHTSYOURS AND OURS • What about leadership? • How can we make evidence based instructional decision making more accessible and meaningful?
THE POWER OF DATA ANALYSIS TO INFORM IMPROVEMENT A Presentation to MSBA/MASA Annual Conference Bill Elder and Howard Jones Office of Social and Economic Data Analysis University of Missouri October 22, 2010