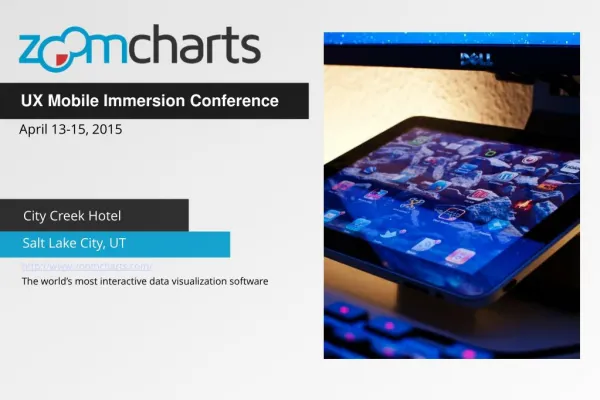
ZoomCharts for UX Mobile Immersion Conference in Salt Lake
ZoomCharts is offering data visualization tools to support speakers at the UX Mobile Immersion Conference 2015, taking place April 13th to 15th at Salt Lake Marriott Downtown at City Creek Hotel, 75 South West Temple, Salt Lake City, UT 84101.
Check out what you can do with ZoomCharts charts and graphs at http://zoomcharts.com
ZoomCharts is a leading data visualization provider, offering the world’s most interactive data visualization software. All charts and graphs are responsive and interactive, support massive data, and can be used on all modern devices, with incredibly fast performance speed. Be among the growing number of professionals discovering the exciting potential that ZoomCharts has in improving the efficiency of data analysis and presentation.
The UX Mobile Immersion Conference is designed for people who are serious about taking UX design to the next level. The three day event features two full days of intriguing workshops and one day of informative guest speaker talks. Engage in fascinating discussions on media queries, image optimization, multi-device design, native apps, design patterns, wireframes, and so much more.
Check out this year’s keynote speakers:
Jen Simmons will be talking about Innovation and the Power of the Web. With over 20 years of design experience, and with a client list that includes Google, MIT Press, and the New York Stock Exchange, Jen is probably best known as the host of podcast The Web Ahead, about the future of the Web and changing technologies.
Jared Spool will be presenting his topic, Is Design Metrically Opposed? Jared is the founder of user research organization User Interface Engineering (UIE), and with over 30 years of experience in usability and design, is a highly knowledgeable voice on the subject of usability.
ZoomCharts
http://www.zoomcharts.com
The world’s most interactive data visualization software
★
★
★
★
★
192 views • 6 slides