ZoomCharts for Web Afternoon in Atlanta Georgia
ZoomCharts is offering data visualization tools to support participants at Web Afternoon, taking place March 27th, 2015 from 1-6pm at Polygon Atlanta, 264 19th Street NW, Suite 2250, Atlanta, Georgia 30363.
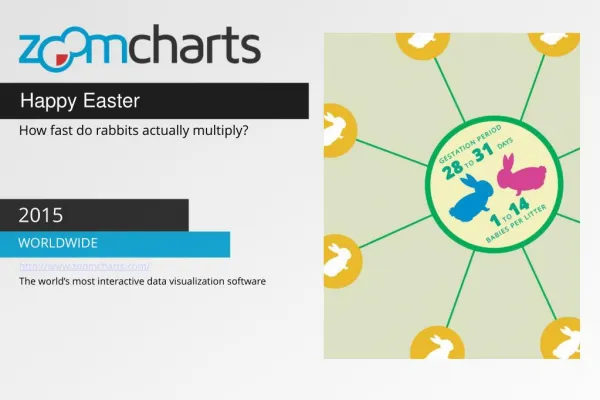
Check out what you can do with ZoomCharts charts and graphs at http://zoomcharts.com
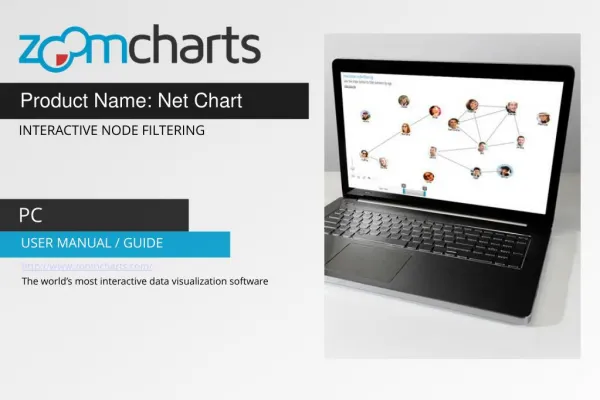
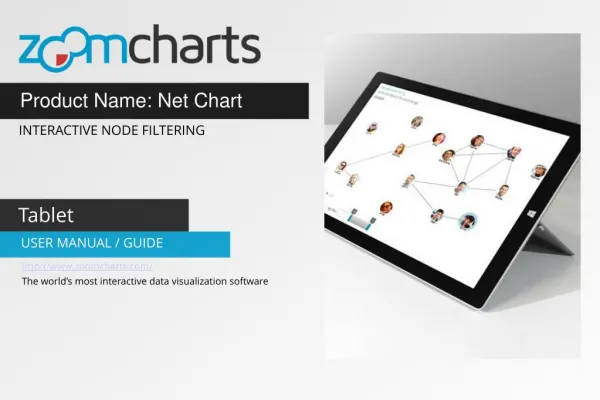
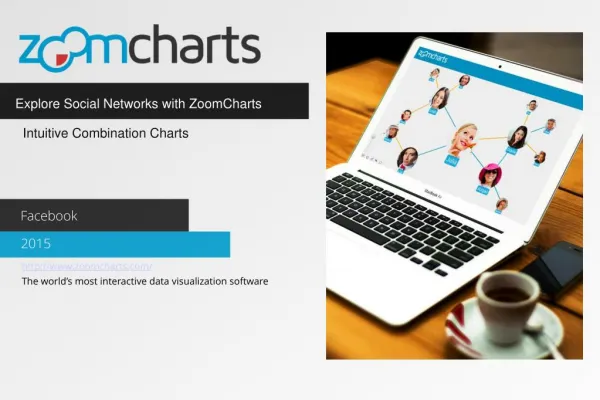
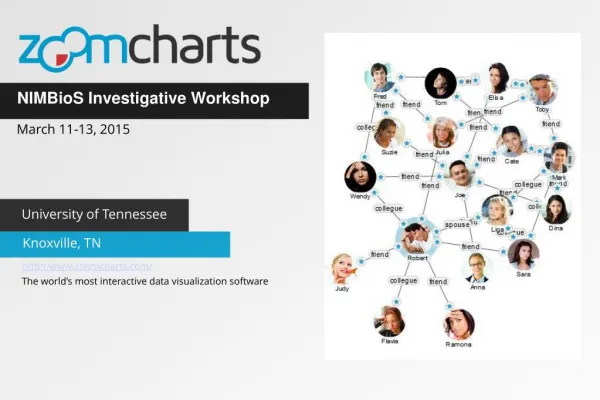
ZoomCharts is the world’s most interactive data visualization software. All charts and graphs are completely interactive, support big data sets, work on all modern devices including touch screens, and perform at incredibly fast speeds. Be among the growing number of professionals discovering the exciting potential that ZoomCharts has in improving the efficiency of data analysis and presentation.
Web Afternoon is an event that gives people who love the Web a chance to interact, network, and connect with other people who share the same interests. The event includes talks by keynote speakers and local thought leaders, panel discussions, group activities, and mingling opportunities with other attendees. The focus is on quality content from experts at an affordable cost.
Keynote speakers and thought leaders include Martin Ringlein, CEO of nvite, Greg Hoy, Principal of Happy Cog & Bureau of Digital Affairs, Doc Waller, Inspiration Architect of Becoming Possible, Anna McDevitt, Owner of Laboratory Tactical Consulting, Chidi Afulezi, Co-Founder of The Core, Fabio Carneiro, Lead Email Developer at MailChimp, Vicky Jones, President of Brand Fever, Sophia Voychehovski, Founder of ReWired UX Studio, Rosario Robinson, Sr. Manager Community Engagement at Anita Borg Institute, Alankar Tayal, Usability Strategist at Sage Software, Melanie Crissey, Client Success Manager at Rigor, John Saddington, Hacker at Desk App, Jennifer Fix, VP of Marketing & Client Services of 352 Inc., Erica Stanley, Founder of Acire Studios, and M. Cole Jones, Co-Founder of covello.
Sponsors of the event include MailChimp, CoffeeCup, Nine Labs, Atlanta Web Design Group, and Adobe Creative Cloud.
Check out Zoom
★
★
★
★
★
206 views • 5 slides