Download
1 / 16
160 likes | 298 Vues
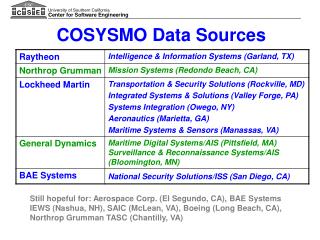
Overview of Addressing Risk with COSYSMO. Garry Roedler & John Gaffney Lockheed Martin. March 17, 2008. Agenda. This presentation describes: Risk Enhancements made by Lockheed Martin to the “Academic COSYSMO” systems engineering estimation model/tool.

E N D
Overview of Addressing Risk with COSYSMO Garry Roedler & John Gaffney Lockheed Martin March 17, 2008
Agenda • This presentation describes: • Risk Enhancements made by Lockheed Martin to the “Academic COSYSMO” systems engineering estimation model/tool. • The results from the COSYSMO Workshop at the PSM meeting in July 2007.
The Situation • Uncertainty is a fact of business life. • Key business and technical decisions need to be made in the face of uncertainty, e.g., cost and schedule. • Yet, often, business capture and execution teams develop only “the” point estimates for effort and schedule without any statement of: • The degree of uncertainty in these values • The overrun exposure they imply. • This undoubtedly contributes to the number of red programs
Background • Risk and reuse enhancements for SE cost estimation have been Implemented in the LM version of the COSYSMO tool, “COSYSMOR,” or “COSYSMO Risk and Reuse.” • The enhancements relate to concerns that have been discussed at various COSYSMO working group and PSM meetings. • Major driver was to get away from “single point” cost estimates • Better recognize the uncertainty associated with estimates.
Summary of Enhanced COSYSMOR Functions The COSYSMOR model/tool provides four major functions in addition to those provided by Academic COSYSMO: • Estimation of Cost/Effort and Schedule Uncertainties: “Risk” and “Confidence”: Provides quantification of the impacts of uncertainties in the values of key model parameter values. They are multiple cost and schedule values with associated probabilities. • Representation of Multiple Types of Size Drivers: Provides for entering counts of: new, modified, adopted (reused), and deleted types for each of the four size driver categories. • Labor Scheduling: Provides the spread of systems engineering labor for five systems engineering activities and across four development phases (time). • Labor Allocation: Provides for the user to select the percentage allocations of the twenty activity/phase pairs or effort elements. This presentation will focus on just the Risk function.
The COSYSMOR User Enters 3-Value Estimates For: • Model Parameters A and E • Scope or Project Size Characteristics, Equivalent Size Drivers: • Number of System Requirements • Number of System Interfaces • Number of System-Specific Algorithms • Number of Operational Scenarios • Cost/Performance Characteristics, Cost Drivers: • Requirements Understanding • Architecture Understanding • Level of Service Requirements • Migration Complexity • Technology Risk • Documentation • # and diversity of installations/platforms • # of recursive levels in the design • Stakeholder team cohesion • Personnel/team capability • Personnel experience/continuity • Process capability • Multi-site coordination • Tool Support
COSYSMOR Data Entry Three-point data entry for size and cost drivers.
COSYSMOR Data Entry (Cont’d) Three-point data entry effort (A) and exponent (E) values
Use this Graph to help understand labor (and cost) exposure for your choice of labor (say to be bid in a proposal) Example: The risk of exceeding 6000 labor hours is slightly less than 20%. Note: You might choose to present only the smooth curve fit rather than the discrete plot.
This table summarizes the data from the effort risk and the “ideal” schedule risk estimates.
PSM Practical Software and Systems Measurement A foundation for objective project management 2007: The Breakout Year for COSYSMO Wed-Thurs (7/25-26) John Rieff/John Gaffney/Garry Roedler PSM Users Group Conference 23-27 July 2007 Golden, Colorado
Next Steps/Action Items from COSYSMO Workshop at PSM User Group Conference • Agreed to Expand COSYSMO to cover Risk and Reuse i.e., add to COSYSMO baseline • Peer Review the User’s Guide by mid-Sept • Harmonize “COCOMO Suite” of estimation models/tools for Systems Engineering/System of Systems/Software Cost Estimation • Clarify system hierarchies as they relate to size driver counts, levels of recursion and unit effort • Verify that any proposed changes do not invalidate early calibration efforts
For Further Information, Contact: • John Gaffney j.gaffney@lmco.com 301-721-5710 • Garry Roedler garry.j.roedler@lmco.com 610-354-3625 856-792-9406
Concerning Risk Distributions • COSYSMOR provides “risk” and “confidence” distributions for the labor and schedule or project duration estimates, based three-point values for each of its parameters that the user enters. • Risk=Prob[actual value >target value]; the complementary cumulative distribution function (CCDF). Confidence=100%-Risk%=Prob[actual≥ target value]; the cumulative distribution function (CDF) of the cost. • Note: these definitions apply to quantities for which “better” is smaller, e.g., effort/cost and project duration. They are reversed for cases in which “better” is larger, such as Mean-Time-Between Failure. • The COSYSMOR risk assessment capability is implemented using three-point approximations; they are non-parametric, meaning that they are not derived as approximations to any particular distribution such as a Gamma or a Weibull. • This in contrast to the use of Monte Carlo methods, in which a particular distribution is used and then a large number of instances are generated from it. • COSYSMOR does not generate such a large number of instances. • Rather, it generates an approximation to the distribution from the 3 point approximations to each variable. For example, if there are 4 (mutually independent) variables, the approximation has 81 values (=3x3x3x3).
Probability Approximation Used In COSYSMOR • COSYSMOR implements the approximation developed by Keefer and Bodily, the “extended Pearson-Tukey” method. • They evaluated 22 approximations, and found this one to be the best in terms of their abilities to estimate the means and variances of various distributions. • This method approximates a continuous distribution by a discrete one: