1 / 3

Diagram 1. Real växelkurs och relativ BNP mot euroområdet Index 1992:Q4=100

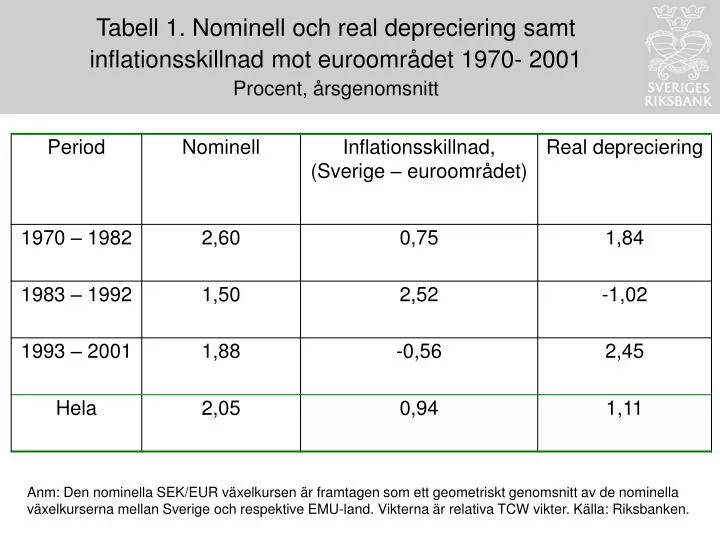
Tabell 1. Nominell och real depreciering samt inflationsskillnad mot euroområdet 1970- 2001 Procent, årsgenomsnitt.

Télécharger la présentation

Diagram 1. Real växelkurs och relativ BNP mot euroområdet Index 1992:Q4=100

An Image/Link below is provided (as is) to download presentation Download Policy: Content on the Website is provided to you AS IS for your information and personal use and may not be sold / licensed / shared on other websites without getting consent from its author. Content is provided to you AS IS for your information and personal use only. Download presentation by click this link. While downloading, if for some reason you are not able to download a presentation, the publisher may have deleted the file from their server. During download, if you can't get a presentation, the file might be deleted by the publisher.

E N D

Presentation Transcript


  1. Tabell 1. Nominell och real depreciering samt inflationsskillnad mot euroområdet 1970- 2001Procent, årsgenomsnitt Anm: Den nominella SEK/EUR växelkursen är framtagen som ett geometriskt genomsnitt av de nominella växelkurserna mellan Sverige och respektive EMU-land. Vikterna är relativa TCW vikter. Källa: Riksbanken.

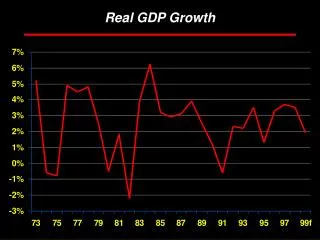
  2. Diagram 1. Real växelkurs och relativ BNP mot euroområdetIndex 1992:Q4=100 Källa: Riksbanken

  3. Diagram 2. Terms of tradeProcentuell förändring sedan 1970 Källa: Riksbanken

More Related