Architecting The RAYTHEON Production Cost Model (RPCM)
280 likes | 519 Vues
ASEA. Architecting The RAYTHEON Production Cost Model (RPCM). George Stratton Systems Engineering Advanced Systems Economic Analysis Raytheon Missile Systems Tucson, Arizona. Quentin Redman Systems Engineering Advanced Systems Economic Analysis Raytheon Missile Systems

Architecting The RAYTHEON Production Cost Model (RPCM)
E N D
Presentation Transcript
ASEA Architecting The RAYTHEON Production Cost Model (RPCM) George Stratton Systems Engineering Advanced Systems Economic Analysis Raytheon Missile Systems Tucson, Arizona Quentin Redman Systems Engineering Advanced Systems Economic Analysis Raytheon Missile Systems Tucson, Arizona Matthew Kehret RMS IT EBusiness Development Raytheon Missile Systems Tucson, Arizona Raytheon Production Cost Model (Arch RPCM.ppt) - GLS
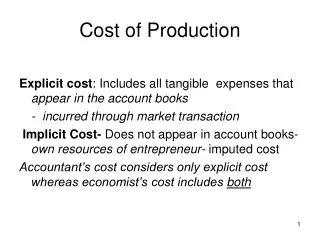
The Raytheon Production Cost Model - Why We Bothered to Create Another Cost Model • A complete understanding of the product’s cost • Track and report costs on various production programs • Production cost projections for three similar programs • Track and manage costs in order to meet the Design to Cost (DTC) goals • Cost data is presented to developers and managers in a form that allows them to make decisions in a timely manner • Evaluate design changes, preplanned product improvements and productivity improvements • Ability to track and take advantage of commonality across all production programs • Visibility into supplier information • Ability to determine the overall business impact of program changes to schedule and loss of award. • Implement economic order quantity vs. schedule vs. supplier data relationships Unique Unique Unique Raytheon Production Cost Model (Arch RPCM.ppt) - GLS
Cost Control/Estimating Problem: How to Account for Commonality? • Common/Similar Components • Circuit Cards • IMU • Warheads/Propulsion • etc. • Common Suppliers • Propulsion Vendor • Electronics Vendor • Control Vendor • etc. Raytheon Production Cost Model (Arch RPCM.ppt) - GLS
GP Smart Weapon With Advanced Propulsion Concept Guidance Section Canard Housing Steel Bulkhead Propulsion Payload Aftbody Aft Obturator Nozzle Must Estimate Costs for Multiple Weapons Raytheon Production Cost Model (Arch RPCM.ppt) - GLS
Model Architecting Step Wise Process GP Program Modeling Needs Draft Model Spec ASEA Modeling Needs Survey Potential Users – Needs? RPCM Requirements IT Tools and Capabilities RPCM Development Plan Raytheon Production Cost Model (Arch RPCM.ppt) - GLS
SYSTEM ARCHITECTURE Model schedule – The Guided Projectiles business’ need was the driving factor. Their requirement for a near term model forced us into a spiral development process User usability requirements drive environment – schedule, standalone vs network - laptop, desktop, multiple users. Requirement to be Certifiable - drives modeling algorithms to industry standards e.g. supplier quotes, learning curves and rate curves along with government approved financial factors. Architecture – TheModel’s requirements to be able to deal with commonality among components, program build up requirements, ability to model various future years buy requirements and financial factors drove model to be built upon a relational data base. The model must be able to treat total component production across all programs then allocate that production back out to the various programs demanding that production. The basic production cost for the components is estimated at the component level. Then at the program level, all program level economic factors are applied and all components with in the program are summed to arrive at the program level cost Raytheon Production Cost Model (Arch RPCM.ppt) - GLS
Programs With Common Components Processor CCA FPA and CCAs Battery Raytheon Production Cost Model (Arch RPCM.ppt) - GLS
Programs With Common Component Suppliers IMU Cables & Harnesses Ordnance/Warhead and Fuse Raytheon Production Cost Model (Arch RPCM.ppt) - GLS
Initial requirements document was used to create an outline of the system functionality User roles were derived from requirements Initial requirements document was translated into a categorized list of succinct requirement statements Each bullet from the categorized list was mapped to system functionality System capability was broken into executable units and used to define each iteration of development Requirements to Design Raytheon Production Cost Model (Arch RPCM.ppt) - GLS
General Requirements • All Up Round Production Costs • Future phases may include other cost (i.e. Operations & Support, etc.) • Will use ‘part/task numbers’ to capture LOE, non-recurring costs • Must have ability to apply support (vs hourly) wrap-rates to support lines • Ability to identify & manipulate common parts across programs • All algorithms • Quantity Curve + Learning • Rate Curve • Rate Applications (i.e. cost, price, burden, etc.) • Price Breaks and Quotes • Model validation • Calculations • Functionality • Output presentation Data Controls • Commonality (part used interchangeably on multiple programs) • May or may not have the same part number • Have ability to manually flag part numbers as common where part number nomenclature is different • Recurring/Non-recurring • Flag with the ability to summarize by Recurring/Non-recurring • Prime Material $, Labor Hours • Labor Hours will be converted to Labor Dollars using ‘wrap rates’ as provided by the user • Burdened Cost, Price • Recurring Costs • Theoretical First Unit (T1) cost • Learning curve (lot by lot) • Step-down (lot by lot) • Rate curve • Rates and Factors • Production Schedules (Production Phase) • Configuration (BOM - WBS) Raytheon Production Cost Model (Arch RPCM.ppt) - GLS
Data Controls (2) • Non-recurring Costs • Cost for each alternative being evaluated • Hardware changes • P31 • Producability • Business • Pre-determined cost goals and targets • Groundrules and assumptions • Assumed economics (FY$, TY$, & Units) • Assumed quantity • Cost or price indicator • Commonality assumption • Data Validation (Error Checking) • Validation of input data • Confidence Indicator • Ability to flag each part number with a code • Table with ability to add/change/delete codes • CURRENT QUOTE • OLD QUOTE • PURCHASE ORDER HISTORY • NTE BUDGETARY • ESTIMATED VS. SIMILARITY • SCALED OR MODIFIED ESTIMATE • ENGINEERING ESTIMATE • ROM • ROLL-UP Raytheon Production Cost Model (Arch RPCM.ppt) - GLS
Determine Objectives, Alternatives & Constraints Risk/Analysis Prototype Plan Next Phase Build Unit Test I&T AT O&S Develop, Verify Next Level Product Spiral RPCM Developmental Phases Spiral Development Over Multiple Phases (more?) Rapid Spiral Development • PHASES Features • Ρ1 — Sept. 01 - Dec. 01 Requirements & MS Access Framework (Parts DB) • Ρ2 — Dec. 01 - Jan. 02 Quotes Data and Excel Reports (4 + Data Dump) • Ρ3 — Feb. 02 - March 02 Learning Curve (LC) Cum. Qty and Excel Input • Ρ4 — April 02 - June 02 Learning Curve - Rotation & Step Down • Ρ5 — June 02 - July 02 Part Commonality & LC Fix (True Cum Avg.) • Ρ6 — Aug. 02 - Sept. 02 Extend Production Years & Fixed Cost • P7 — Oct.02 - July 03 Manufacturing Build Up, Expand Reports, & User Interface Update & Rate Curves Raytheon Production Cost Model (Arch RPCM.ppt) - GLS
RPCM PROJECT SUMMARY (circa March 2002) • Phase 1- 1 December 2001 • Model Spec. and Requirements Generated • Model Structure Coded • Parts Data - Quotes, Learning, Level Of Effort, Lot Recurring and Lot Level of Effort • WBS - Multiple Programs Unique and Standard • Financial Factors - Wrap Rates • Roll up and Learning Curve Estimating Equations for Parts • BOM • Model Filled with “Projectiles” Provided Data (used for testing) • Stand Alone Capability • Ability to model and store “what if” scenarios. • Output = 3 described reports and a data dump to excel • Phase 2- Early January 2002 • Cumulative Average Learning Step Functions For Individual Parts • Stand Alone Version - ability to edit data • Phase 3- March 2002 • Step up/down and multiple steps on Cumulative Average Curve for individual parts • Stand Alone Version - ability to upload data to master • Reports Log, new versions, Scenarios, etc. • Phase 4- (Next) Raytheon Production Cost Model (Arch RPCM.ppt) - GLS
SCENARIO 2 SCENARIO 1 Program Data PGMM WBS QTY by Year XM982 WBS QTY by Year ERGM WBS QTY by Year RPCM Overview Parts Data Base Part A - “Quote” Part B - Learning Curve Part C - Level of Effort Part D - Part E - Part F - REPORTS Phase 1 consists of 3 Graphs a Data Dump all in Excel Model Parametrics Financial Equations Cum. Average Learning Built Up Rates & Factors Raytheon Production Cost Model (Arch RPCM.ppt) - GLS
Supplier Quantity Quotes Rate Curve Quantity Buy Options • Built in to RPCM • Fixed Costs • Supplier Quantity Quotes • Rate Curves • Learning Curves • Smooth • Steps • Rotations Raytheon Production Cost Model (Arch RPCM.ppt) - GLS
Quantity Buy Options – Cont. • Built in to RPCM • Fixed Costs • Supplier Quantity Quotes • Rate Curves • Learning Curves • Smooth • Steps • Rotations Raytheon Production Cost Model (Arch RPCM.ppt) - GLS
Visual Source Safe was used to track configuration of source code Used Relational Database Collected as many of the system requirements and user expectations as early possible Wire-Framing / Mock Ups Wire-Framing is a term used to describe a text based description of the application flow, where the each screen in the system and their associated functionality is defined Mock Ups are complete visualizations of each screen in the application Followed a variation of eXtreme Programming Followed: Customer was highly available and consulted regularly during development Small and well defined iterations were released to user community System metaphor was determined Daily Status/Stand Up meetings Unit Tests Regular builds Not Followed: “Pair Programming” (i.e. – TWO developer to ONE computer) Software Development Approach Raytheon Production Cost Model (Arch RPCM.ppt) - GLS
Developed as a client-server application, using Visual Basic 6.0 (VB) as the front-end and MS Access as the data repository Requirement for the tool to work on a laptop in a “disconnected” environment Followed all applicable industry based VB naming standards and implemented classes Software Environment Raytheon Production Cost Model (Arch RPCM.ppt) - GLS
Phase I - Process Flow CRI - Not in Phase I Initial Data DB Validation Subsequent Data Input Validation/ Detailed Reports Report Selection Data Analysis/ Manipulation Data Preparation Rate Table Update Security Maintenance Summarized Tabular Data Graphs User Interface (VB) System (VB) Excel MS Access Raytheon Production Cost Model (Arch RPCM.ppt) - GLS
Drop down selection for Production Phase Customer Program System Function Manually input Part Number (must define ‘parent/child relationship’ Flag for ‘commonality’ if available via different customer/program (and part number is unique) Data Input Window Subsequent Data Input Raytheon Production Cost Model (Arch RPCM.ppt) - GLS
Drop down selection for Production Phase Customer Program System Function Manually input Part Number (must define ‘parent/child relationship’ Data Analysis/Manipulation Window Data Analysis/ Manipulation Raytheon Production Cost Model (Arch RPCM.ppt) - GLS
Phase I - Reports Summarized Tabular Data Graphs • Stacked bar graphic and tabular data • By System by fiscal year • By System by function by fiscal year • More Requirements forth coming • Both include ground rules and assumptions User Interface (VB) System (VB) Excel MS Access Raytheon Production Cost Model (Arch RPCM.ppt) - GLS
Phase I - Position Capture Summarized Tabular Data Graphs • In Phase I, Users will be responsible for capturing ‘positions.’ That is, positions will be accomplished by captured/archived using Excel. • For example: Reports created on 15 Dec 01 could be saved as 15_dec_01.xls and rpts created on 15 Jan 02 could be saved as 15_jan_02.xls. Variances between positions could be displayed using Excel (as created by the User) User Interface (VB) System (VB) Excel MS Access Raytheon Production Cost Model (Arch RPCM.ppt) - GLS
Validating and verifying requirements document specified the right equations and methodologies for the developer to follow and that these items were functionally implemented in the application. Code walkthroughs were held between the developers and the process experts to ensure that all of the equations and processes defined in level one were followed correctly in the code. A regression database was created that stores a small set of data used in conjunction with the model, for which the right final end product answers have been pre-calculated by hand and also simulated by spreadsheet. After each iteration of changes is made to the model, regression tests are run and their output is compared to that provided by the hand calculations and previous runs. This check helps to ensure that each development iteration does not impact calculations that were already validated and correctly functioning within the model. Test plans - With the test plans and regression database in hand, testers have repeatable test processes that help to ensure all key aspects of the application are tested for each iteration and produce the desired output. “Ghost” results for a period of time, ensuring that the new model was arriving at the same answer as the older models MODEL VALIDATION Raytheon Production Cost Model (Arch RPCM.ppt) - GLS
Creating the model under these conditions created a number of interesting lessons learned. The major ones are: 1st. Constant and consistent staffing is a must – no variances in staffing levels should be allowed and continuity of personnel is a must. The first time we went around the spiral, there was a change in cost engineering and software personnel. The new personal had to learn what went before. Fortunately, we were able to keep our chief engineers (systems and software) so there was a corporate memory. 2nd. Assure “complete” budget before starting. Stops, starts and staffing reductions will all cause increased schedule and total project cost increases. 3rd. Systems Engineering - Complete at least the required minimal flow chart with equations prior to beginning coding. Missing levels of understanding of the set of requirements, even in a spiral development environment, can cause an unacceptable level of rework. 4th. Have your final product in mind at all times and work towards it. Intermediate steps should be steps on the path to reach that ultimate product. LESSONS LEARNED Raytheon Production Cost Model (Arch RPCM.ppt) - GLS
Implementation (Roll Out) • Preferred Tool for Design Cost Goal Tracking (New) • GP (3 Programs) • Classified • In Process Raytheon Production Cost Model (Arch RPCM.ppt) - GLS