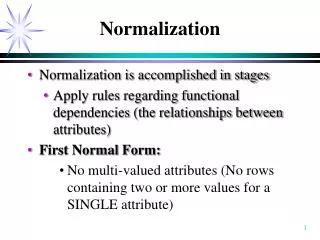
Normalization
Normalization. Getting the numbers comparable. Question Experimental Design. The DNA Array Analysis Pipeline. Array design Probe design. Sample Preparation Hybridization. Buy Chip/Array. Image analysis. Normalization. Expression Index Calculation. Comparable Gene Expression Data.

Normalization
E N D
Presentation Transcript
Normalization Getting the numbers comparable
Question Experimental Design The DNA Array Analysis Pipeline Array design Probe design Sample Preparation Hybridization Buy Chip/Array Image analysis Normalization Expression Index Calculation Comparable Gene Expression Data Statistical Analysis Fit to Model (time series) Advanced Data Analysis Clustering PCA Classification Promoter Analysis Meta analysis Survival analysis Regulatory Network
Sample contamination RNA quality Sample preparation Dye effect (cy3/cy5) Probe affinity Hybridization Unspecific signal (background) Saturation Spotting Other issues related to array manufacturing Image segmentation Array spatial effects Expression intensities are not just target concentrations
Gene-specific variation Spotting (size and shape) Cross-hybridization Dye Biological variation Effect Noise Global variation RNA quality Sample preparation Dye Hybridization Photodetection Two kinds of variation in the signal Systematic Stochastic
Gene-specific variation: Too random to be explicitly accounted for “noise” Global variation: Similar effect on many measurements Corrections can be estimated from data Normalization Sources of variation Systematic Stochastic Statistical testing
* * * * * M * * A Lowess Normalization • One of the most commonly utilized normalization techniques is the LOcally Weighted Scatterplot Smoothing (LOWESS) algorithm.
The Qspline method • From the empirical distribution, a number of quantiles are calculated for each of the channels to be normalized (one channel shown in red) and for the reference distribution (shown in black) • A QQ-plot is made and a normalization curve is constructed by fitting a cubic spline function • As reference one can use an artificial “median array” for a set of arrays or use a log-normal distribution, which is a good approximation.
Once again…qspline Accumulating quantiles When many microarrays are to be normalized to each other an average array can be used as target
Invariant set normalization (Li and Wong) • A invariant set of probes is used • Probes that does does not change intensity rank between arrays • A piecewise linear median line is calculated • This curve is used for normalization
After intensity After spatial normalization normalization Spatial normalization Raw data After intensity After intensity Spatial bias estimate After spatial After spatial normalization normalization normalization normalization
Question Experimental Design The DNA Array Analysis Pipeline Array design Probe design Sample Preparation Hybridization Buy Chip/Array Image analysis Normalization Expression Index Calculation Comparable Gene Expression Data Statistical Analysis Fit to Model (time series) Advanced Data Analysis Clustering PCA Classification Promoter Analysis Meta analysis Survival analysis Regulatory Network
- Perfect Match (PM) - MisMatch (MM) Expression index value • Some microarrays have multiple probes addressing the expression of the same target • Affymetrix GeneChips have 11-20 probe pairs pr. Gene However for downstream analysis we often want to deal with only one value pr. gene. Therefore we want to collapse the intensities from many probes into one value: a gene expression index value PM: CGATCAATTGCACTATGTCATTTCT MM: CGATCAATTGCAGTATGTCATTTCT
Median Expression index calculation • Simplest method? But more sophisticated methods exists: dChip, RMA and MAS 5
dChip (Li & Wong) • Model: PMij =qifj+ eij Outlier removal: • Identify extreme residuals • Remove • Re-fit • Iterate • Distribution of errors eij assumed • independent of signal strength (Li and Wong, 2001)
RMA • Robust Multi-array Average (RMA) expression measure (Irizarry et al., Biostatistics, 2003) • For each probe set, re-write PMij = ijas: log(PMij)= log(i) + log(j) • Fit this additive model by iteratively re-weighted least-squares or median polish
MAS. 5 • MicroArray Suite version 5 uses • Signal = TukeyBiweight{log(PMj - MM*j)} • MM* is an adjusted MM that is never bigger than PM • Tukey biweight is a robust average procedure with weights and outlier rejection
Methods compared on expression variance Standard deviation of gene measures from 20 replicate arrays • Std Dev of gene measures from 20 replicate arrays Expression level RMA: Blue and Red MAS5: Green dChip: Black From Terry speed
MAS 5.0 Log fold change estimate from 20ug cRNA Log fold change estimate from 1.25ug cRNA Robustness • MAS5.0 • (Irizarry et al., Biostatistics, 2003)
Robustness • dChip • (Irizarry et al., Biostatistics, 2003) dChip Log fold change estimate from 20ug cRNA Log fold change estimate from 1.25ug cRNA
Robustness • RMA • (Irizarry et al., Biostatistics, 2003) RMA Log fold change estimate from 20ug cRNA Log fold change estimate from 1.25ug cRNA
All of this is implemented in… • R • In the BioConductor packages ‘affy’ (Gautier et al., 2003).
References • Li and Wong, (2001). Model-based analysis of oligonucleotide arrays: Model validation, design issues and standard error application. • Genome Biology 2:1–11. • Irizarry, Bolstad, Collin, Cope, Hobbs and Speed, (2003) Summaries of Affymetrix GeneChip probe level data. • Nucleic Acids Research 31(4):e15.) • Affymetrix. Affymetrix Microarray Suite User Guide. Affymetrix, Santa Clara, CA, version 5 edition, 2001. • Gautier, Cope, Bolstad, and Irizarry, (2003). affy - an r package for the analysis of affymetrix genechip data at the probe level. Bioinformatics