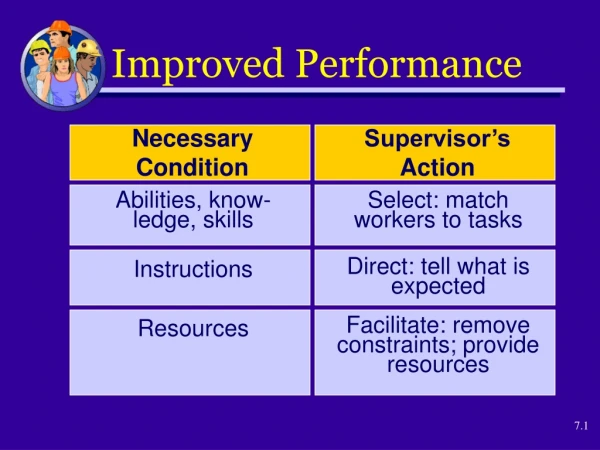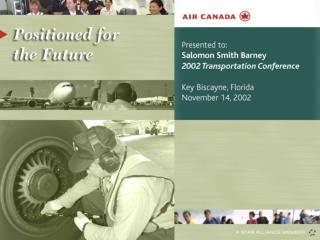
Improved Performance
Improved Performance. 2002 2001 (millions) Q2 Q2 Change Oper. Revenue $ 2,552 $2,564 $ (12) Oper. Expense 2,490 2,636 (146) Oper. Income (Loss) 62 (72) 134 Non-oper. Expense (46) (71) 25 Income (Loss)

Improved Performance
E N D
Presentation Transcript
Improved Performance 2002 2001(millions) Q2 Q2 Change Oper. Revenue $ 2,552 $2,564 $ (12) Oper. Expense 2,490 2,636 (146) Oper. Income (Loss) 62 (72) 134 Non-oper. Expense (46) (71) 25 Income (Loss) Before FX & Tax $ 16 $ (143) $ 159 FX on L/T Monetary Items 19 161 (142) Income (Loss) Before Tax $ 35 $ 18 $ 17
Best Operating Results* of any Major International Carrier in North America % OPERATING MARGIN 2001 2002 * Pre-government assistance - US = 6 majors
Air Canada Revenue Recovering Faster Q2 2002/2001 % CHANGE
Air Canada’s 2nd Quarter RASM Outperforms Industry YEAR/YEAR % CHANGE 2002 2001 * Mainline ** Source ATA
July/August Traffic* Stable YEAR/YEAR % CHANGE 2002 * Mainline
Air Canada Unit Cost** Performance Outpaces US Industry YEAR/YEAR % CHANGE 2002 2001 * Mainline * * Adjusted for one-timers; US = 6 majors
All Expense Categories Down Except Ownership, User Fees, Mtce. and Insurance Q2 2002/2001 Mainline
Higher Fleet ProductivityY-T-D Aug ASM’s* 2%, Block Hrs* 10% YEAR/YEAR % CHANGE 2002 ASMs Block Hours * Mainline
Positioned For The Future 1. Multi-brand strategy 2. Increasing employee productivity 3. Falling distribution costs 4. Fleet simplification and commonality 5. Six Sigma 6. Low cap-ex and moderate debt repayment
Air Canada’s Products - Tango • Low fare/leisure • Simplified product • Supplemental flying in key markets • Medium, long haul • Domestic, transcontinental, sun • Point to point • No interlining • Low product cost • Mainline labour cost
Air Canada’s Products - Zip • Low fare/business/ leisure • Simplified product • Domestic/transborder • Point-to-point, short haul • Full interlining • Low product cost • Low labour cost
Underlying Tango Profitability • Revenue certainty • no overbooking, no denied boardings • No refunds • Single class seating • Low distribution costs • 80% to 90% internet bookings • Global Distribution Systems (GDS) by-pass • all e-ticket • “All frills extra” onboard service • No interlining, no baggage transfer • Fast turnaround, higher aircraft utilization • Low overhead
Employee Productivity Continues To Improve ASM per EMPLOYEE** * Air Canada Pre-merger Air Canada + CAIL as of June 30/00 Combined ASM = Available Seat Mile * YTD + estimate for balance of year ** Mainline
Agency Commissions Cut By More Than Half Since 1998 COMMISSIONS AS % OF PASSENGER REVENUE 9.3% 7.6% 6.6% 5.9% 4.4% * * YTD + estimate for balance of year
Narrow Body FleetMoving to all Airbus 2000 2002 CRJ 15% CRJ 16% DC-9 10% B-737 17% Airbus 49% Airbus 67% To be replaced with Airbus aircraft when leases expire - some initially going to Zip. B-737 26% 167 Aircraft 157 Aircraft
2002 2003 8 MBB 15 MBB 30 BB 120 BB 320 GB 1,380 GB Implementing Six Sigma Trained Personnel Target Areas • Operations • Airports, Air Canada Technical Services, System Operations Control, Flight Ops, Inflight Services, Call Centres, Air Canada Jazz, Aeroplan, Air Canada Vacations • Staff • Marketing, Sales, Network Planning, Human Resources, Law, IT, Purchasing, Destina.ca MBB = Master Black Belt, BB = Black Belt, GB= Green Belt
Low Cap-Ex & Moderate Debt Repayment • Cap-Ex • Annual steady state cap-ex = $200 million • 2003 & 2004 aircraft deliveries fully financed • ten A319/320/321s • two A340-500s • three A340-600s • Debt Repayment • $375 million second half of 2002 (mostly behind us) • $220 million in 2003
Good Liquidity • $0.9 billion in cash at June 30, 2002. • Generating positive cash flow from operations. • Approximately $2.8 billion of unencumbered assets • aircraft • engines and spares • inventory • real estate • lease deposit receivables • accounts receivable