Download
1 / 8
80 likes | 220 Vues
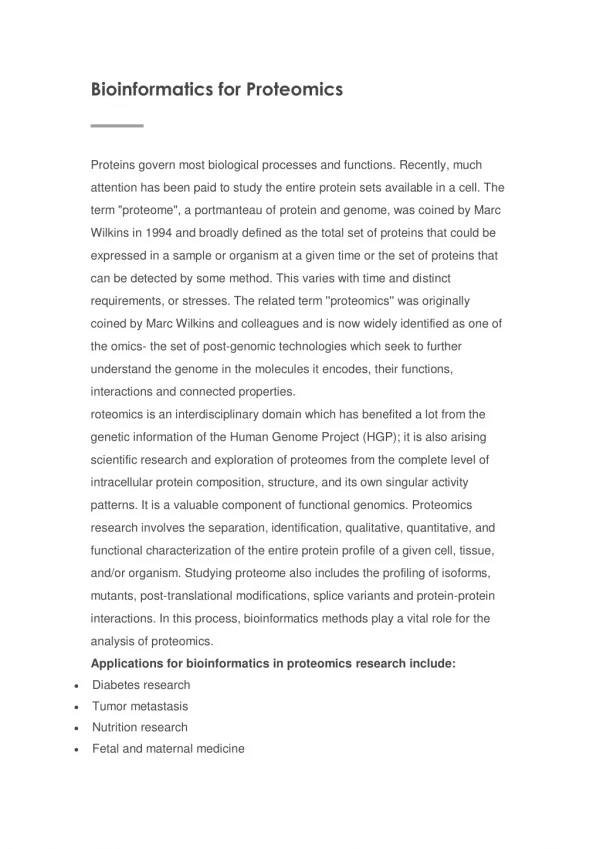
This study evaluates the effects of MIPE on cell viability and cytotoxicity in LNCaP and PANC1 spheroids and adherent cultures. We utilized CellTiterGlo™ to measure viability after 7-14 days of clonal seeding. Results indicate that cell viability is ≤30% across various conditions. Furthermore, the active CRC measurements reflect IC50 values for LNCaP and PANC1, highlighting the differential sensitivity of these cell lines to treatment. Supplemental figures provide visual representation and detailed data for further analysis.

E N D
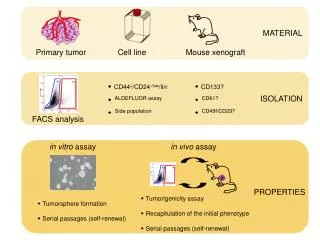
Supplemental Figure 1 Addition of controls and MIPE to both A CSC Spheroid Isolation Dissociation of spheroids/ Clonal seeding into assay plate 7-14 days Spheres 2 days Measure Cell viability (CellTiterGloTM) SCM+KO+ITS SCM+KO+ITS B Cell Seeding DMEM or RPMI+5%FBS Adherent C D
Supplemental Figure 2 ≤30% viability in both LNCaP/PANC1 ≤30% viability in Sphere ≤30% viability in both Sphere/Adherent ≤30% viability in Adherent ≤ 30% viability in PANC1 viability ≤30% in LNCaP 2 19 5 7 2 28
Supplemental Figure 3 Active CRC in both LNCaP/PANC1 Active CRC CRC in Adherent Active CRC CRC in Sphere Active CRC in both Sphere/Adherent Active CRC in PANC Active CRC in LNCaP 5 5 31 16 8 24
A B IC50 (mM) 12.5 IC50 (mM) 1.481 C Cell Line CRC IC50 (mM) LNCaP A -1.2 0.007 LNCaP S -1.1 0.04 PANC1 A -1.4 0.03 PANC1 S -1.4 0.01 Supplemental Figure 4
Cell Line CRC IC50 (mM) LNCaP A -2.4 45.6 LNCaP S -2.1 40.7 PANC1 A -2.4 1 PANC1 S -1.4 45.6 Supplemental Figure 5