Download
1 / 35
360 likes | 555 Vues
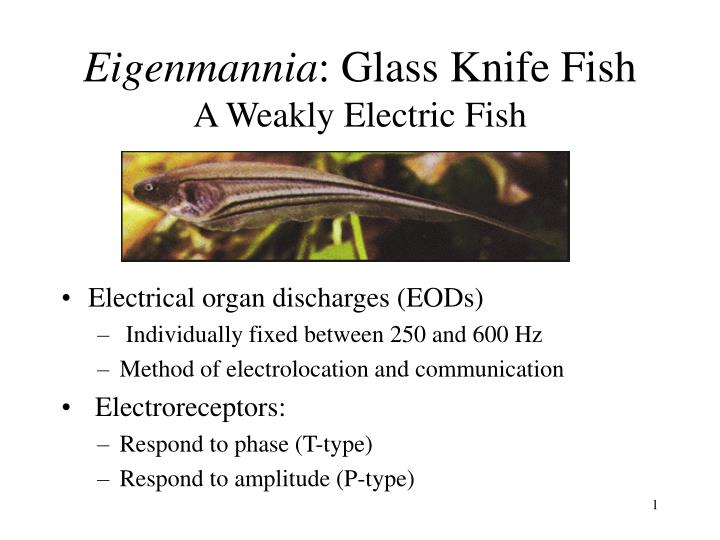
Eigenmannia : Glass Knife Fish A Weakly Electric Fish. Electrical organ discharges (EODs) Individually fixed between 250 and 600 Hz Method of electrolocation and communication Electroreceptors: Respond to phase (T-type) Respond to amplitude (P-type). Jamming Avoidance Response.

E N D
Eigenmannia: Glass Knife FishA Weakly Electric Fish • Electrical organ discharges (EODs) • Individually fixed between 250 and 600 Hz • Method of electrolocation and communication • Electroreceptors: • Respond to phase (T-type) • Respond to amplitude (P-type)
Jamming Avoidance Response • Two fish will adjust EOD if frequencies are similar enough. • Before: Fish A: 304 Hz, Fish B 300 Hz. • After: Fish A: 312 Hz, Fish B 292 Hz. • Uses T-type and P-type receptors to compute whether EODs should be raised or lowered. • Role of T-type well understood. This paper examines the role of P-type. Electrical Field
The P-type Receptor Cells • Single afferent projections to Electrosensory Lateral Line (ELL) lobe of the medulla • Tuned to the EOD frequency of the individual • Loosely phase locked • Fire < 1 per electric cycle, though as amplitude increase firings/per cycle goes to one
Stimulus and Electrophysiology • T = Blank Tape Produces White Noise (the stimulus) • Can vary the Standard Deviation • BF = Output passed through low-pass filter with variable cut-food frequency • Can Vary the Cut-Off Frequency (fc) • FG = function generator (next slide) • Electrodes in Mouth and Near tail produce electric field, to which receptors respond Insert 1A here
The Function Generator • A0 is the Mean Amplitude • s(t) is the white noise after it has passed through a filter • fcarrier is equal to the EOD
Recordings • Recordings of P-type receptors at the animals trunk • Identified P-type receptors by 3 criteria: • Probability of firing per cycle < 1 • Spontaneous activity was irregular • Units phase locked with large jitter • 26 units selected • Recordings of 135 seconds for 3 Protocols • Spontaneous activity • Response to wide-band white noise (fc= 740 Hz) • Varying fc, Ao, and standard deviation of s(t) in a pseudo random manner
We represent the spike train, resulting from the stimulus, to be • A linear estimate of the stimulus given the spike train obtained by convolving the spike train with the filter Theory ti – spike occurrence time X0 – mean firing rate.
h(t) was chosen to minimize the square error between the stimulus and the stimulus estimate • The integration is over the duration of the experiment (T=135sec) • fc is cut-off frequency • Ssx is Fourier transform of the cross correlation function of the stimulus and the spike train. • Sxx is the Fourier transform of the auto correlation function stimulus and the spike train.
Now we can determine: • We determine “noise”, as the distance between the original stimulus and the estimated stimulus: • Signal To Noise Ratio, SNR(f), as the power spectrum of the • of the stimulus divided by the power spectrum of the noise Measure the amount of signal power present at a given frequency relative to the noise. SNR = 1 means that it is impossible to differ the signal from the noise.
Measure of rate of mutual information that is transmitted by the reconstructions about the stimulus. • Coding Fraction, a normalized measure of the quality • of reconstruction (Mean square error in the reconstruction) • Dividing by the firing rate λ , yields the mutual information transmitted per spikeIs=Ie/ λ ( 0 < γ < 1 ), and for max error γ is 0
Data Analysis How we obtained the data for the above equations: • Spike Sample: The spike peak occurrences times were selected and resample at 2KHz together with the stimulus.(2KHz because we saw that we are interested in frequencies bellow 740, say 1000 and then nyquist…) • Filter: - Estimate of the cross correlation between spike trains and stimulus was obtained by Fast Fourier transform. (Ssx,Sxx) • SNR: - Estimate of the stimulus and spikes power spectra were obtained using Fast Fourier transform and averaging 130 samples of data, each 1024msec long.
The stimulus estimation were obtained by convolving the filter and the spike train in the frequency domain using Fast Fourier Transform. Here to avoid contamination by the carrier frequency of the spike train, they set the filter to zero for frequencies greater than fcarrier – 30Hz. • Experimental errors were either obtained directly by repeated measurements or by error propagation
Results Response to sinusoidal stochastic amplitude modulations – spontaneous activity • P-type receptor afferent units fire with increased probability when the amplitude of the external electric field is raised. 10Hz sinusoidal amplitude modulation and the corresponding poststimulus histogram.
The spontaneous activity of P units appears consistent with the assumptions of stationary probability density for the spike distribution.
Increasing mean stimulus amplitude, increase the probability of firing. A=1.0, λ=233 A=0.8, λ=208 A=0.6, λ=174 A=0.5, λ=152 A=0.4, λ=112 A=0.3, λ= 98 A=0.2, λ= 55 A=0.1, λ= 24
Temporal Bandwidth For wide band white noise stimulus 740Hz, checking over 13 units: SNR always equal to 1 for frequencies > 200Hz. and reconstruction is poor γ = 0.0024 (<2.5%) For white noise stimulus 175Hz, while keeping power spectrum constant. SNR improved and more faithful reconstruction γ = 0.222.
Cutoff Frequency The coding fraction γ decreased with increasing fc. Decreasing the fc of the stimulus, increase the SNR at lower frequencies.
Why? 1. The power spectra density was increased in the range of frequencies encoded by the units. 2. The power spectra density of the signal was reduced at high frequencies. Two experiments were made to check these assumption. - fc of the stimulus was kept fixed, and the power density was increased. - fc of the stimulus was increased, and the power density was kept constant.
Effect of Mean Firing Rate • Dynamic Range of mean firing rate from spontaneous firing rate to fcarrier (limit once/cycle) • Signal-to-Noise Ratio increases as firing rate increases, but saturates at ½ fcarrier
Coding Fraction, Information Rate, Information Per Spike • Coding Fraction, Information Rate also increases and saturates at the same points (Figure a and b), while Information per Spike decreases upon saturation (c) • Lower Cut-Off Frequency Steeper slope in Coding Fraction • fc =175 vs. fc =88 Hz • No significant influence of the spontaneous firing rate on the slope of the coding fraction. (Fig. A and B) • Significant coding occurred 20-40 Hz above spontaneous discharge
Standard Deviation and Signal-to-noise Ratio • Varying the Standard Deviation is the same as increasing the amplitude • Max. standard deviation set at .25 to avoid phase changes • Signal-to-Noise Ratio increases with standard deviation
Coding Fraction, Information Rate, Information Per Spike • All three of these increase with Standard Deviation • Dotted lines are one unit at three mean firing rates (bottom 70, middle 110, and top 170) • Larger mean firing rates: • Initial slope larger • Saturation reached at lower standard deviation
Discussion • Studied Encoding Information • Signal-to-Noise • Mutual Information Rate • Coding Fraction • Despite the Noise, single afferents encode much of the stimulus
Technical Considerations • The head and tail electric field geometry most effective in jamming avoidance response • They may have chosen T-Type cells, however their data suggest otherwise (P-Type).
Reverse Correlation and Linear Reconstruction Filter • Spiked were typically triggered by large positive slope in the stimulus. • Neither the Biophysical interpretation nor the computational properties that could be read from the filter are obvious. • The filter h(t) changes when the statistics of the stimulus or the mean firing rate of the units changes.
Their observation of the filter argue against the notion that there is a single cell that explicitly reconstruct the stimulus. • The results are true for the assumption that the white noise stimuli is coded with stationary statistics and that the spike train is stationary in response to the stimulus.
Existence of nonlinearities • The experiment show that adding high frequencies to the stimulus reduce the signal to noise ratio at low frequencies. This indicates that the receptors’ response to electric field amplitude modulation is nonlinear.
Natural stimuli 1. A typical power spectrum of natural amplitude modulations around the fish in its natural behavior has not been measured. 2. Amplitude modulations caused by small moving objects have been estimated to be between 2 – 80Hz. They showed that SNR and fraction of signal encoded in single spike trains increase as the cutoff frequency of the stimulus decrease between 740-88Hz. (slide18) More experiments were done, decreasing fc to 2, 20, 50 that verified these results.
mean firing rate, dynamic range spontaneous activity • The mean firing rate λ, increase with the mean amplitude A0. This enable them to study the coding performances as function of λ by changing A of the stimulus. • The SNR, mutual information rate and coding fraction increased with increasing mean firing rate, for firing rates between the spontaneous activity and half of fcarrier. • Coding started for mean firing rates 20-40Htz above the spontaneous discharge.
Coding fraction and mutual information both reached maximum at about half of fcarrier. • There is a differential sensitivity of the coding fraction and the mutual information transmission as fcof the stimulus was changed. • Anesthetized fish have lower spontaneous activity and EOD frequency, thus reduced firing rate than untreated fish, therefore the measured firing rate may not be the optimal one.
Standard Deviation and Contrast • Coding Fraction, etc. increased with an increase in Standard Deviation • Because Mean Firing Rate was constant and only Standard Deviation changed, better performance was not due to more firing
Upper Bound on Performance • Upper Bound = fcarrier because max of one spike per electric cycle • Coding fraction at upper bound given by equation below. • For these experiments fcarrier = 400 Hz and fc = 100 Hz, so coding fraction is 0.75 • P receptors can code >1/2 the information that can be encoded about a stimulus
Behavioral Relevance • Information from the P receptors to the CNS depends on: • Mean firing rate • fc of the stimulus, as will as its contrast • Similar results in mammalian visual system? • Individual P receptors covey accurate and efficient representation • Convergence makes more accurate and more efficient?