Download
1 / 55
550 likes | 696 Vues
Governance, Corruption and Development: Empirics, Lessons and Implications for the Bank. Daniel Kaufmann, The World Bank Institute www.worldbank.org/wbi/governance Core Course on Governance & Anticorruption February 14th, 2006, World Bank, Washington, DC

E N D
Governance, Corruption and Development:Empirics, Lessons and Implications for the Bank Daniel Kaufmann, The World Bank Institute www.worldbank.org/wbi/governance Core Course on Governance & Anticorruption February 14th, 2006, World Bank, Washington, DC "If you cannot measure it, you cannot improve it." – Lord Kelvin
Challenging Convention – key tenets? • Good Governance = Anti-Corruption • Governance Measurement Skepticism • Unmeasurable, or, • Measurable, but so imprecise that it is not useful, or, • Measurable, but only through ‘Objective’ Indicators • Cannot Assess Trends: Unreliable or No Time Series 3. Some evidence: Governance has improved globally? 4. Good Governance: outcome of development and growth? – & emerging economies are corrupt…? 5. The trouble with Public Sector & Officials in LDCs... 6. Cultural & Historical Determinism of Corruption 7. Fighting corruption by ‘Fighting Corruption’ (Laws, Codes, Campaigns, Agencies & Regulations
Tenet # 8: Challenging the previous 6 ‘popular notions’ • Data Matters -- on Governance & Institutions: while ‘sensitive’, & margins of error (not uniquely) – data can be gathered, analyzed, and used judiciously • Expanding Beyond the Washington Consensus-- Adding to the Macro and the Structural’/Sectoral: Institutions, Governance and Corruption Matters • On Average: stagnation on Governance, and level is low -- Has it become a binding constraint nowadays? • Significant variance: some countries show that it is feasible to improve governance in the short term • Interventions that have not worked – vs. what may work better in the future? – Transparency matters • Strategic and Operational Implications
The ‘Power of Data’: Technical progress in measurement -- gradual increase in use • The ‘Macro’/Aggregate Level of Measurement: Worldwide Aggregate Governance Indicators: 200 countries, 6 components, periodic. • ‘Mezzo’: Cross-Country Surveys of Enterprises • ‘Micro’: Specialized, in-depth, in-country Governance and Institutional Capacity Diagnostics: Includes surveys of: i) user of public services (citizens); ii) firms, and, iii) public officials On ‘Aggregate/Macro’ Level first…
Six Dimensions of Governance Governance as the set of traditions and institutions by which authority in a country is exercised -- specifically: • The process by which those in authority are selected and replaced • VOICE AND ACCOUNTABILITY • POLITICAL STABILITY & ABSENCE OF VIOLENCE/TERRORISM • The capacity of government to formulate and implement policies • GOVERNMENT EFFECTIVENESS • REGULATORY QUALITY • The respect of citizens and state for institutions that govern interactions among them • RULE OF LAW • CONTROL OF CORRUPTION
Governance Data • Data on governance from 37 different sources constructed by 31 different organizations • Data sources include cross-country surveys of firms, commercial risk-rating agencies, think-tanks, government agencies, international organizations, etc. • 352 proxies for various dimensions of governance • Organize these measures into six clusters corresponding to definition of governance, for five periods: 1996, 1998, 2000, 2002, 2004
Sources of Governance Data • Cross-Country Surveys of Firms: Global Competitiveness Survey, World Business Environment Survey, World Competitiveness Yearbook, BEEPS • Cross-Country Surveys of Individuals: Gallup International Voice of the People, Latinobarometro, Afrobarometer, Vanderbilt University/USAID
Sources of Governance Data, Cont’d • Expert Assessments from Commercial Risk Rating Agencies: DRI, PRS, EIU, World Markets Online, Merchant International Group, IJET Travel Consultancy, PERC • Expert Assessments from NGOs, Think Tanks: Reporters Without Borders, Heritage Foundation, Freedom House, Amnesty International, Bertelsmann Foundation, Fundar, International Research and Exchanges Board, Brown University, Columbia University, Binghamton University • Expert Assessments from Governments, Multilaterals: World Bank CPIA, EBRD, AFDB, ADB, UNECA, State Dept. Human Rights Report
Examples of Governance Questions • Expert assessment polls • Government interfere w/ private investment? (RQ) • How transparent and fair is the legal system? (RL) • Risk of coup, civil war, org. crime, terrorism? (PV) • How severe is the bureaucratic red tape? (RQ) • What is risk of loss of FDI due to corruption? (CC) • Freedom of the press, expression, association (VA) • Survey Responses • % bribery “to get things done”? (CC) • Transparent info given by government? (GE) • % Management Time spent on red tape?(RQ) • Access & quality of government services? (GE)
Building Aggregate Governance Indicators • Use Unobserved Components Model (UCM) to construct composite governance indicators, and margins of error for each country • Estimate of governance: weighted average of observed scores for each country, re-scaled to common units • Weights are proportional to precision of underlying data sources • Precision depends on how strongly individual sources are correlated with each other • Margins of error reflect (a) number of sources in which a country appears, and (b) the precision of those sources
Control of Corruption: one Aggregate Indicator (selected countries from 204 worldwide, for illustration, based on 2004 research data) Margins of Error Good Governance Governance Level Poor Governance Source for data: : 'Governance Matters IV: Governance Indicators for 1996-2004’, D. Kaufmann, A. Kraay and M. Mastruzzi, (http://www.worldbank.org/wbi/governance/govdata/); Colors are assigned according to the following criteria: Dark Red, bottom 10th percentile rank; Light Red between 10th and 25th ; Orange, between 25th and 50th ; Yellow, between 50th and 75th ; Light Green between 75th and 90th ; Dark Green above 90th.
Government Effectiveness, 2004: World Map Source for data: : 'Governance Matters IV: Governance Indicators for 1996-2004’, D. Kaufmann, A. Kraay and M. Mastruzzi, (http://www.worldbank.org/wbi/governance/govdata/); Colors are assigned according to the following criteria: Dark Red, bottom 10th percentile rank; Light Red between 10th and 25th ; Orange, between 25th and 50th ; Yellow, between 50th and 75th ; Light Green between 75th and 90th ; Dark Green above 90th.
Regulatory Quality, 2004: Latin America & Caribbean Source for data: : 'Governance Matters IV: Governance Indicators for 1996-2004’, D. Kaufmann, A. Kraay and M. Mastruzzi, (http://www.worldbank.org/wbi/governance/govdata/); Colors are assigned according to the following criteria: Dark Red, bottom 10th percentile rank; Light Red between 10th and 25th ; Orange, between 25th and 50th ; Yellow, between 50th and 75th ; Light Green between 75th and 90th ; Dark Green above 90th.
Precision vs. Number of Sources, KKZ Governance Estimates, 2000/01 0.7 0.6 0.5 0.4 Margin of Error 0.3 0.2 0.1 0 Note: See explanatory details in this slide’s note 0 2 4 6 8 10 12 14 Number of Sources Per Country
Is Governance Improving Worldwide? • Sobering Comparison between Governance and other dimensions over time • Sobering for worldwide averages, but variance is present, and also offers bright spots and hopeful lessons
Significant Decline in Inflation Rates Worldwide High Inflation (avg. in logs) Low Source: ‘Rethinking Governance’, based on calculations from WDI. Y-axis measures the log value of the average inflation for each region across each period
Quality of Infrastructure Source: EOS 1997-2003 (Quasi-balanced panel). Question 6.01: General infrastructure in your country is among the best in the world?
Judiciary Independence (EOS survey resuls 1998-2004) High Independence No Independence
No Significant Trend in Control of Corruption Worldwide Averages Good Poor PRS country coverage in 1996: 129, all other periods 140; QLM and EIU country coverage: 115 for all periods.
Press Freedom in the World, 1995 vs. 2004: Stagnant? % countries in 2004 % countries in 1995 Source: Freedom House. Y axis measures percentage of countries in the region with free press (rating of 30 or below), partly free (ratings between 30 and 60) and not free (rating above 60).
Are all Countries Stagnating in Governance? • The world on average has not improved • But large or small variation across countries? • New method: for each country, we can identify whether there are significant changes over time • It is found that changes can take place in the short-term: in 6-to-8 years, some deteriorations as well as some significant improvements as well
Changes in Rule of Law, 1996-2004 Major Deterioration (selected countries) Insignificant Change Major Improvement (selected countries) Changes were calculated on the basis of the differences in country estimates from 1996 and 2004. Classification for major deteriorations and improvements were based on 75% confidence interval. Source for data: http://www.worldbank.org/wbi/governance/govdata/.
Governance Indicators: Zimbabwe, 2004 vs. 1996 Source for data: http://www.worldbank.org/wbi/governance/govdata2002 ; Colors are assigned according to the following criteria: Dark Red, bottom 10th percentile rank; Light Red between 10th and 25th ; Orange, between 25th and 50th ; Yellow, between 50th and 75th ; Light Green between 75th and 90th ; Dark Green above 90th.
Governance Indicators: Chile, 2004 vs. 1996 Source for data: http://www.worldbank.org/wbi/governance/govdata2002 ; Colors are assigned according to the following criteria: Dark Red, bottom 10th percentile rank; Light Red between 10th and 25th ; Orange, between 25th and 50th ; Yellow, between 50th and 75th ; Light Green between 75th and 90th ; Dark Green above 90th.
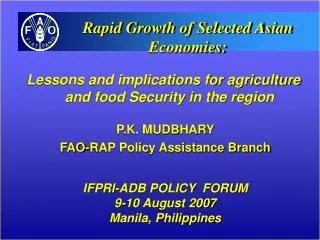
Governance Matters: The 300% ‘Dividend’ • Large Development Dividend of Good Governance: a one-standard-deviation improvement in governance raise incomes per capita in a country by about 300% in long-run • But is such a decline in corruption unrealistically large?: NO -- One S.D. is the difference from: Eq. Guinea Iran or Uganda Mauritius Portugal Finland or New Zealand • The impact is from governance to incomes, and not viceversa -- higher incomes alone will not do • Urgency of interventions to improve governance
Development Dividend From Good Governance $30,000 $3,000 $300 Data Source for calculations: KK 2004. Y-axis measures predicted GDP per capita on the basis of Instrumental Variable (IV) results for each of the 3 categories. Estimations based on various authors’ studies, including Kaufmann and Kraay.
The ‘Mezzo’ Level of Governance Measurement • Based on cross-country surveys, mainly of enterprises – (such as the EOS of WEF, BEEPS/WBES of WB, etc.) • Thousands of firms interviewed on a range of issues; focus on governance, specialized questions • More detailed unbundling of governance and corruption phenomena than aggregate indicators • Relatively broad country coverage, but less than aggregate governance indicators • Measuring what is taking place De Facto matters: it uncovers stark realities masked in De Jure indicators • Addresses empirically: ‘It takes two to “tango”’
Some Key Constraints to Business, by Region, Responses from the Firm in EOS 2005 % firms reporting constraint among top 3: Source: EOS 2005. The question posed to the firm was: Select among the above 14 constraints the five most problematic factors for doing business in your country. Note that the overall EOS sample covers 120 [CHECK] countries, and in some regions –particularly in the Middle East, Africa and the FSU, many countries are not surveyed. Thus, regional averages need to be interpreted with caution, since typically countries not surveyed tend to rate lower in governance than those surveyed.
Unbundling Bribery (responses by firms, eos 2005) % Firm Report High Bribery (1-3) Bribery in: Source: EOS firm survey, WEF2005 – 117 countries. Question: In your industry, how commonly firms make undocumented extra payments or bribes connected with permits / utilities / taxation / awarding of public contracts / judiciary? (common…never occurs).
Bribery in Procurement: Enterprise Responses, 2005 % Firms Report Bribery in Public Procurement Frequent Source: EOS firm surveys, WEF. Question: In your industry, how commonly firms make undocumented extra payments or bribes connected with awarding of public contracts?
Figure 11: Better Governance is Associated with Higher Country’s Competitiveness High r = 0.90 Low Low High Sources: GCI drawn from EOS firm survey, WEF 2005 – 117 countries; Control of Corruption from Kaufmann, Kraay and Mastruzzi, ‘Governance Matters IV: Governance Indicators for 1996-2004’.
Multinationals Bribe Abroad?% Firms Reporting Frequent Procurement Bribery, EOS 2005 Source: EOS, preliminary.Question: In your industry, how commonly would you estimate that firms make undocumented extra payments or bribes connected with the following: permits, public utilities, tax payments, loan applications, awarding of public contracts, influencing of laws, policies, regulations and decrees to favor selected business interest, and judicial decisions. Any firms reporting answers 1 through 3 were considered to be reporting at least high frequency of bribery, while answers 4 through 7 were not.
Perceptions Matter Perceptions-based data on governance are useful: • Often only alternative (e.g. corruption) • Captures more closely the concept being measured • De facto measures are closer to ‘on the ground’ phenomena than objective ‘de jure’ information • Perceptions do matter • ‘Perception’ questions are now more rigorous, experiential and quantitative • Ideological & other biases: concerns are exaggerated • Their margins of error are not unique • Adds insights that ‘objective’ data does not
The ‘Micro’ Level – In-depth in-country diagnostics for action programsKey Features of Governance Diagnostic Tools • Multi-pronged surveys of: households, firms and public officials [‘triangulation’] • Experientialquestions (vs. ‘opinions’/generic) • Local Institution Implements, w/WB Collaboration • Recognizing Multidimensionality of Governance • Focus on Service Delivery • Input for Action and Change: Action Programs
In a diagnostic in a Latin American country, misgovernance is a regressive tax (similarly in other countries) Bribe/Total Income ratio, %
Extent of Integrity in Institutions in Guatemala (2004 Diagnostic, responses from service users; firms, and public officials)
‘Unbundling’ Bribery: Guatemala, 2003-05 % Firms Report High Bribery (1-3) Source: EOS firm survey by the World Economic Forum, 2002-05. Question: In your industry, how commonly firms make undocumented extra payments or bribes connected with permits/utilities/taxation/awarding of public contracts/judicial decisions?
Citizen Voice Helps Control Bribery (Bolivia Diagnostics) Based on 90 national, departmental, and municipal agencies covered in the Bolivia Public Officials Survey.
Transparency within Government Agencies Prevents Purchase of Public Positions Based on 90 national, departmental, and municipal agencies covered in the Public Officials Survey.
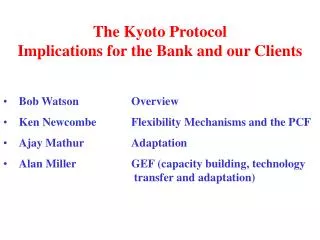
Politicized Agencies tend to have high incidence of Budgetary Leakages Yellow columns depict the unconditional average for each category. Blue line depicts the controlled causal effect from X to Y variables. Dotted red lines depict the confidence ranges around the causal effect depicted by the blue line.
Conclusions and Policy Implications 1. Measuring governance is important • Policymakers, citizens, enterprises and investors know that good governance is key: demand data • Empowers civil society and reformers for change • Helps donors assess aid effectiveness • Enables policy-relevant research on causes and consequences of good (and bad) governance 2.Measuring Governance is feasible • Important to exercise care, margins of error matter • ‘Objective’ Indicators are also challenged • Being precise about degree of imprecision in all data
Policy Implications, Cont’d 3. Governance Matters: large “development dividend” • strong causal impact of governance on incomes, but little evidence that higher incomes raise governance • Thus, no rationale for applying a ‘governance discount’ to poor countries 4. The world on average is ‘stagnant’– some countries have improved significantly, others deteriorated, many stagnated 5. Need to refocus efforts to improve governance • frank questioning of what doesn’t ‘hold water’: -- Anti-Corruption campaigns -- Drafting more laws, codes, and Conventions -- Create additional ethics and A-C agencies -- ‘Blame’ History, Culture or Legal Origins -- ‘Blame’ Reform, Privatization, Globalization
What Appears to Work or Holds Promise… • ‘Data Power’ / Metrics Matters • Voice and Accountability – incl. Freedom of the Press • Transparency Strategy and Reforms (vs. Over-Regulations) • Focus on Incentives and on Prevention • Political Reform, including on Political/Campaign Finance • Working with the Corporates, MNC, Banking Sector • Capital Markets Development – as ‘market-disciplining’ • For Rich/Donor Countries, & IFIs: ‘Tougher Love’ on Governance may make a difference? – on some of the above
Some Lessons from Evidence – Worldwide Cross-Country Consequences and Costs of Corruption: • Lower Incomes and less Investment; • Higher Poverty & Inequality • Major reduction in global competitiveness • But no automatic virtuous circle (from incomes) Some Determinants of Corruption: • Capture and Undue Influence by Vested Interests – & Political Finance Mechanisms • Absence of ‘Voice’ & Transparency Mechanisms • Subpar Judiciary • Over-Regulation of Enterprise sector • Lack of Leadership / No Commitment from the Top
No Evidence to support some ‘popular’ notions on Anti-Corruption (A-C) strategies • ‘Ring-fencing Projects’ (vs. systemic approach) • Incessant drafting of new A-C laws/regulations • Creating another A-C (or Ethic) Commission • Technical & Supply-side focus on institutions • Tinkering w/ Globalization; halting Privatization • Cultural, Regional or Historical/Legal Determinisim …by contrast, what may be particularly important…
Deserving particular attention… • External Accountability Mechanisms (voice), ‘Data Power’ + Transparency Reforms • Incentives and Prevention as drivers • The Role of the Firm and Elites (influence, capture) • Politics-- including Political/Party Finance • Revamped approach to Judicial/Legal reforms • For Bank Strategy: i) Higher Selectivity (all levels);ii) Supporting Country Systemic & Sectoral Reforms (incl. role of CAS); iii) Demand Side of Governance Reforms; iv) WB Projects: focus on Prevention, and, v) Engage Private Sector
Some Issues for debate at the Bank at this juncture • What to do less of?: traditional PSM; legal fiat; Anti- Corruption commissions; traditional TA, computers • More focus on ‘demand side’ of governance: CSOs, Business sector, Local, Media –Transparency Reforms • WBG & Private Sector Nexus for Anti-Corruption • Leadership: Focus; young leaders; & subnational • Revisit ‘Capacity’:hardware/organization vs. governance • Politics: better understanding; Finance Reform • Competitiveness Link, & Joining Elite Global Clubs • Innovating at the Sectoral & Project Level (infr bids..) • Governance as ‘umbrella prism’: implications for full portfolio & sectors (vs. same 5th road project..?)
Policy applications- Transparency reforms as second generation institutional change • Despite potential benefits, transparency reforms insufficiently integrated into reform programs • Transparency reforms can be substitutes to costly (over)- regulation, to creation of additional public institutions (eg. A-C agencies) and to incessant legal drafting • Transparency reforms have low financial cost, and high benefits: net savers of resources (eg. E*procurement) • Transparency reforms may require political capital: but where present, technocratic areas where IFIs have a role • Transparency reforms well-suited to be “entry points” catalyzing further institutional change, since: i) effective in changing incentives of political leaders to serve broad social groups, and ii) politically more feasible
10 Transparency Initiatives in a Strategy • Public Disclosure of Assets and Incomes of Public Officials, Politicians, Candidates, Legislators, Judges, & dependents • Public Disclosure of Political Campaign contributions by individuals and firms, and of campaign expenditures • Public Disclosure of Parliamentary Votes, without exceptions • Effective Implementation of Conflict of Interest Laws, separating business, politics, legislation, & government • Publicly blacklisting firms bribing in public procurement • Effective Implementation of Freedom of Information Law, with easy access by all to government information • Fiscal/Financial transparency: central/local budgets; EITI • Transparency in Ownership and Financial Status of Banks • E*procurement: transparency (web) and competition • Governance Diagnostic Surveys and PETS