Investigating Sediments
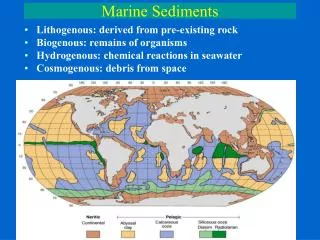
Investigating Sediments. Sediment Sieving Calculating Ca CO 3 Content of Sediment Samples Point Counts Measuring a , b and c axes of Clasts. Sieving of Sediment Samples. After returning from the field with sediment samples in clearly labelled bags

Investigating Sediments
E N D
Presentation Transcript
Investigating Sediments • Sediment Sieving • Calculating Ca CO3 Content of Sediment Samples • Point Counts • Measuring a,b and c axes of Clasts
Sieving of Sediment Samples After returning from the field with sediment samples in clearly labelled bags Open up the bags and pour each sample carefully into a suitable plastic or cardboard container Spread the sediment sample out into a thin layer which completely covers the base of the container Place the containers in a location where they will dry out completely and not be disturbed. A sunny window sill is ideal. Alternatively pour the sample into a foil container and leave in the oven overnight at a temperature of 140°C
Cleaning the Sieve Stack Take a stack of sieves from - 4 to + 4 phi and arrange in descending mesh order from coarsest to finest with the collecting pan at the base Take each sieve in turn and brush vigorously with the special brush to remove any particles trapped from previous investigations
Weighing the Empty Sieves Weigh each sieve empty in turn plus the collecting pan and make a note of the results on A4 paper. Re-assemble the sieve stack in order, coarsest (16mm) at the top to finest (0.063mm) at the bottom with the collecting pan underneath
Preparing to Sieve the Samples Check that the sieves fit snugly together, any possible gaps should be sellotaped, to avoid loss of sediment during shaking Place a suitable container on top of an electronic balance, preferably with an accuracy of 0.1g or better Use the tare facility to zero the display, then carefully add material by hand until 1000.0g appears on the digital display
Sieving the sediment samples Carefully pour the 1kg (1000g) sample into the top sieve and seal with the purpose-made lid Shake the sieve stack for a minimum of five minutes using an up and down action interspersed with a circular motion. It might be worth involving other students here to save on elbow grease! Ideally the sample should be shaken for at least 15 minutes
Re-weighing After Shaking Take off the lid from the sieve stack and carefully dismantle the sieves in size order Re-weigh each sieve and the collection pan with its contents on the electronic balance Record the sieve weight plus sediment value on A4 paper
Calculating the % Calcium Carbonate content of a beach or dune sand sample Place a suitable beaker on an electronic scale that measures to at least the accuracy of 0.1g Press the tare function to re-set the scale readout to zero Gradually add the sand sample by sprinkling it carefully until 5.0g is recorded by the display
Remove the beaker from the scales and gradually pour in a few centimetres of 0.5 molar hydrochloric acid The calcium carbonate content of the sand will effervesce violently and release carbon dioxide Carefully swirl the contents of the beaker until the reaction runs to completion ie stops fizzing
Continue adding acid and stir with a plastic or glass rod to ensure that all grains enter into reactions When the sand/acid mixture stops effervescing all the calcium carbonate in the sample will have been dissolved Weigh a sheet of filter paper on the electronic balance, then make a funnel to filter the sand/acid mixture Rinse out sediment that sticks to the side of the beaker and pour into the filter paper cone
When all the liquid has passed through the filter paper, open it out fully and place in a suitable container on top of absorbent paper Place the container in a location where it will be able to dry out fully and not be disturbed A sunny window sill site or on top of a radiator would probably be ideal
Re-weigh the filter paper and filtrate when fully dry Subtract the weight of the filter paper recorded previously Express the weight loss from the original 5.0g sample of sediment as a percentage This gives the calcium carbonate content as percentage by weight loss
Point Count Of 100 Grains This simple technique allows the mineral composition of a sand sample to be determined as percentage constituents Take an A4 sheet of plain paper and draw a thin black line on it approximately 10cm long. Rub a Pritt Stick (or similar) along the line Carefully sprinkle a sand sample along the line so that the grains are clearly separate from each other Place the paper with the sand grains under a binocular microscope
Bring the sand grains into focus using the binocular microscope with the black line in the centre of the field of vision Using a tally sheet or proforma, to record your observations attempt to identify 100 consecutive grains that lie closest to, or are actually on the black line Experiment with different magnifications x10, x25 and x40 depending on the size of the constituent grains
A Simple Guide To Grain Identification Quartz: grey, white, colourless, glassy, conchoidal fracture, rounded or subrounded grains Feldspars: pink/flesh or creamy white colour, blocky or rectangular shape due to 2 cleavages meeting at 90° Calcite: pinkish, yellowish, brown, white, may show ornament/ribbing if derived from shell fragments Micas: black or silver in colour, pearly lustre, present as thin flakes due to perfect basal cleavage Tourmaline: greenish black in colour, often present as thin needle-like slivers Metallic ore grains: metallic lustre, black, silvery or grey in colour, often appear like bits of ‘screwed up silver paper’ Other: anything that does not fit in with the above
An example from a student’s notebook to show the recording of point counts for a beach and dune sand (2 samples of each)
When the point count of 100 grains has been completed, the composition as percentage constituents can be established This information is easily plotted as a pie chart It is interesting to compare results within the teaching group to see how much variation is evident Remember just 100 grains from a sample of probably many billions is unlikely to be very representative!
Measuring Particle Size and Shape Sediment samples with larger clasts allow measurement of their a, b and c axes The a axis is the longest direction that can be measured on any clast B axes are the maximum distances at right angles to the a axis on the clast C axes are the shortest and are usually the ones on which the clasts would naturally lie, ie are frequently vertical c axis a axis b axis
Measuring Particle Size and Shape • The a, b and c axial values can be measured by eye using a ruler, but much more accurately using external calipers • The Excel sediment spreadsheet calculates values for sphericity and flatness once the axial lengths have been entered into the appropriate cells • The spreadsheet also classifies clasts as spheres, rods, blades or discs and plots them automatically onto a Zinng diagram using b/a and c/b ratios as co-ordinates
Enter the Data into the Excel Spreadsheet Enter the data into the spreadsheet: Sieve weight ‘empty’ Sieve weight ‘full’ a, b and c axial measurements of at least 10 clasts from any one sample The spreadsheet will calculate all the values needed for the investigation
Spreadsheets Periglacial Head 1 80% of material coarser than 1mm Bi modal distribution Positively skewed distribution with a higher proportion of coarser material Very poorly sorted as the line slopes gently from left to right. All sieves and pan contained some material
Spreadsheets Periglacial Head Deposit Sphericity values quite low to moderate from 0.4 to 0.6 Flatness values moderate to high 283 to 475 Most of the clasts, 9 out of 10 classify as blades produced by freeze-thaw?
The End I just absolutely adore doing Geology coursework!