Download
1 / 24
240 likes | 326 Vues
Study evaluates response of middle atmosphere to short-term solar UV irradiance variability using LYRA data, focusing on ozone and hydroxyl. Goals include space weather service preparation with nowcasting capabilities.

E N D
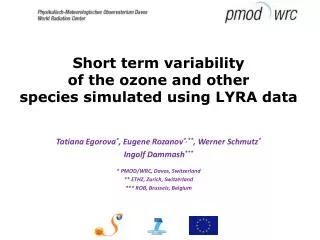
Short term variability of the ozone and other species simulated using LYRA data Tatiana Egorova*, Eugene Rozanov*,**, Werner Schmutz* Ingolf Dammash*** * PMOD/WRC, Davos, Switzerland ** ETHZ, Zurich, Switzerland *** ROB, Brussels, Belgium
Project idea Evaluate the response of the middle atmosphere to the short term solar UV irradiance variability Chemistry ionosphere climate model (CICM) extension of CCM SOCOL (Egorova, JASTP, 2010) LYRA on PROBA2 (ROB & PMOD/WRC) PREMOS on PICARD (PMOD/WRC) On-line LYRA and PREMOS data for space-weather community
Goals • Find out how well we understand the solar influence on the middle atmosphere; • Learn how to manage near-real-time operation; • Space Weather Service is secondary goal but may become interesting if successful ! • Preparatrion to the model extention to upper atmosphere
Nowcast results available on web every 6 hours Output validation to improve the model and experimental set-up Hourly/Daily Data from observations by LYRA, PREMOS, SORCE Nowcasting of neutral and ion composition in the mesosphere based on solar irradiance measurements Nowcast of anomalies of neutral and charged species with CICM SOCOLi Radiation spectrum reconstruction 120-680 nm
Ozone and hydroxyl response to the solar variability January 2004 case study Hydroxyl and ozone in the mesosphere simulated with CCM SOCOL. These components are sensitive to variable solar irradiance because H2O + hv (121.5 nm) => OH + H OH goes up O3 + OH => O2 + HO2O3 decreases
Experimental setup (intended) 10-member model ensemble run for the next 6 hours Hourly model output for the next 6 hours Spectral solar irradiance on model spectral grid for the next 6 hours Initialization fields for the next period Initial fields for 10 ensemble members
Output data 4D: latitude, longitude, altitude, time Mixing ratio of the neutral species and electrons, negative and positive ions density for the 6 hour period after the last LYRA measurement and their statistical properties Charged components: O+, O2+, O4+, N+, NO+, N2+, H2O2+, H3O+,O2+∙N2, O2+∙H2O, H3O+∙OH, NO+∙H2O, NO+∙(H2O)2, NO+∙(H2O)3, NO+∙CO2, NO+∙N2, NO+∙H2O∙CO2, NO+∙H2O∙N2, NO+∙(H2O)2∙CO2, NO+∙(H2O)2∙N2, H+∙(H2O)2, H+∙(H2O)3, H+∙(H2O)4, H+∙(H2O)5, H+∙(H2O)6, H+∙(H2O)7, H3O+∙CO2, H3O+∙N2, H+∙(H2O)2∙CO2, H+∙(H2O)2∙N2 e¯,O¯, O2¯, O3¯, O4¯, OH¯, CO3¯, CO4¯, NO2¯, NO3¯, HCO3¯, ClO¯, Cl¯, CH3¯,O2¯∙H2O, NO3¯∙H2O, CO3¯∙H2O Neutral components: O3 , O* , O , O2*, NO, HO2, ClO, NO2 , OH, NO3, N2O5, HNO3,HONO3, ClONO2, Cl, N, N*, H2O2, H, HOCl, Cl2, Cl2O2, HCl , Br, CH2O, BrO, HBr, HOBr, BrNO3, BrCl, CH3, CH3O2, CH3O, HCO, CH3O2H, H2O, CFC-11, CFC-12, N2O, CH4, CO, H2, CBrF3
Data form LYRA half calibrated (provided by IngolfDammash)
Gap filled LYRA data Lyra R=0.75 Sorce/Solstice, 2008 R=0.58
Solar spectrum reconstruction We have reconstructed solar UV irradiance for 120-680 nm required by the model from LYRA data applying linear regression analysis. We use the following formula for the reconstruction: Fi= A + B Pi F is solar spectral UV irradiance; is wavelength; i is day number; A and Bcorrelation coefficients calculatedSOLSTICE/SORCE and SIM/SORCE for 2008; P is solar irradiance from LYRA (Channel 2). See Egorova et al. (ACP, 2008) for details and accuracy estimation
Experimental set-up Composite 1: 121-220 nm SOLSTICE/SORCE 220-700 nm SIM/SORCE Composite 2: 121-280 nm SOLSTICE/SORCE 280-700 nm SIM/SORCE
Simulation with 1D model: O3 at 80km H2O + hv (121.5 nm) => OH + H O3 + OH => O2 + HO2 O3 and OH in antiphase
Simulation with 1D model: OH at 80km H2O + hv (121.5 nm) => OH + H O3 + OH => O2 + HO2 O3 and OH in antiphase
Simulation with 1D model: electrons at 80km NO + hv => NO++ e- O3 and electrons in phase
Data sampling (daily vis. hourly) Blue- daily Red – hourly
Simulation with 1D model: O3at 60km O2+ hv => O + O O2 + O + M => O3 O3+ hv => O(1D) + O2 O(1D) + H2O => OH + OH O3 and OH in phase
Simulation with 1D model: OH at 60km O2+ hv => O + O O2 + O + M => O3 O3+ hv => O(1D) + O2 O(1D) + H2O => OH + OH O3 and OH in phase
Vertical O3 profile: difference between two composites
Electron density in the tropics Solar UV km SPE GCR Tropical mean time evolution (10-11.2003) of the electron concentration (cm-3).
Conclusions • Ozone, hydroxyl, electron and ion densities show some response to the solar irradiance variability • Lyra data can be used for nowasting! If available in RT mode • Some problems with data and model remain ...