FY 2012 Budget Overview: Revenue and Expense Analysis
190 likes | 322 Vues
The FY 2012 Budget report highlights key revenue sources totaling $34,692,444, including an anticipated $187,200 decrease in CRA revenues due to a 0.50 mill change in the city's millage rate. TIF revenues remain flat, reflecting trends over the past years, with expectations for future stability. Total expenses are projected at $10.8 million, covering personnel, operating costs, and professional services. Notably, the budget includes new investments in community development and redevelopment projects aimed at enhancing local economic growth.

FY 2012 Budget Overview: Revenue and Expense Analysis
E N D
Presentation Transcript
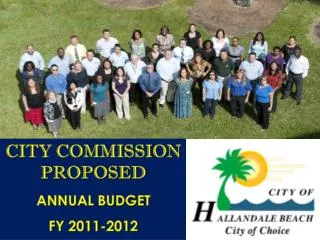
FY 2011- 2012BUDGET September 14, 2011 6:30pm
FY 2012 Budget Revenue Analysis
Revenue & FundBalances:$34,692,444 A 0.50 mill change in City’s Millage, reduces CRA revenues by $187,200 or 4%
Sources of Revenues & Trends • TIF revenues flat • TIF revenues spiked in FY 2009-10 • Expected to remain flat through FY 2015 • Future TIF Revenues: • Ocean Mall – Leasehold Improvements • Publix Store • Florida Power & Light • Rybovich Riviera Beach, LLC • International Harbor at Riviera Beach • Ocean Mall – Hotel
FY 2012 Budget Expense Analysis
Personnel: $610,462 • One new FTE – Community Development Officer (neighborhood development) • Overall expense is flat • 3% merit subject to employee performance and organizational assessment
Professional Services: $1.2 million Ten Largest Professional Services Vendors FY 2010 -2011 Budgeted Amounts
Redevelopment Projects * Includes $364,544 for Professional Services reimbursements
FY 2012 Budget Cash Flow Analysis