Analysis of Variegated Phenotype in Tg.shA57.2-1 Mice via Flow Cytometry
This study examines the variegated phenotype of Tg.shA57.2-1 mice using flow cytometry at seven-month intervals. Peripheral blood cells display a unique double peak fluorescence pattern, indicating distinct levels of transgene expression. Further analysis involves dot plot assessments contrasting forward scatter and GFP expression, and selective antibody staining for cellular identification. CD4 and CD8 T cell subsets, alongside immature and mature B cells, are characterized, revealing no correlation between GFP fluorescence levels and analyzed cell surface markers.

Analysis of Variegated Phenotype in Tg.shA57.2-1 Mice via Flow Cytometry
E N D
Presentation Transcript
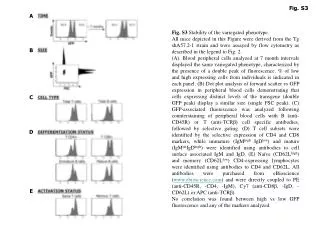
A B C D E Fig. S3 Fig. S3 Stability of the variegated phenotype. All mice depicted in this Figure were derived from the Tg shA57.2-1 strain and were assayed by flow cytometry as described in the legend to Fig. 2. (A). Blood peripheral cells analyzed at 7 month intervals displayed the same variegated phenotype, characterized by the presence of a double peak of fluorescence. % of low and high expressing cells from individuals is indicated in each panel. (B) Dot plot analysis of forward scatter vs GFP expression in peripheral blood cells demonstrating that cells expressing distinct levels of the transgene (double GFP peak) display a similar size (single FSC peak). (C) GFP-associated fluorescence was analyzed following counterstaining of peripheral blood cells with B (anti-CD45R) or T (anti-TCRβ) cell specific antibodies, followed by selective gating. (D) T cell subsets were identified by the selective expression of CD4 and CD8 markers, while immature (IgMhigh IgDlow) and mature (IgMintIgDhigh) were identified using antibodies to cell surface associated IgM and IgD. (E) Naïve (CD62Lhigh) and memory (CD62Llow) CD4-expressing lymphocytes were identified using antibodies to CD4 and CD62L. All antibodies were purchased from eBioscience (www.ebioscience.com) and were directly coupled to PE (anti-CD45R, -CD4, -IgM), Cy7 (anti-CD8β, -IgD, -CD62L) or APC (anti-TCRβ). No correlation was found between high vs low GFP fluorescence and any of the markers analyzed.