Groundwater Availability Issues in Virginia: Impact of Pumping on Aquifer Levels
This report examines groundwater availability issues in Virginia, focusing on significant aquifers such as Yorktown-Eastover, Piney Point, and Aquia. The study highlights the impact of permitted pumping rates by Virginia wells on water levels and aquifer depletion. It includes simulated water levels and comparisons to pre-pumping conditions as of September 2011, providing a comprehensive overview of groundwater storage calculations and violations of the 80% criterion. This analysis aims to inform future water management and preservation efforts in the Coastal Plain region.


Groundwater Availability Issues in Virginia: Impact of Pumping on Aquifer Levels
E N D
Presentation Transcript
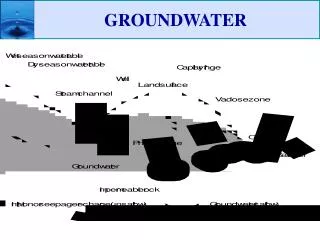
AQUIFERS • YORKTOWN-EASTOVER • PINEY POINT • AQUIA MARINE SEDIMENTS FLUVIAL SEDIMENTS POTOMAC AQUIFER BASEMENT BEDROCK
VA Coastal Plain Aquifer Cross-Section McFarland & Bruce, 2006
Proportional Drawdown from Pre-Pumping Levels WEST EAST +150 +140 100% PRE-PUMPING LEVEL FRANKLIN +100 80% +50 MSL +30 D I P PRESENT-DAY LEVEL 77% POTOMAC AQUIFER -180 -250
Simulated Change in Storage of Water in the Potomac Aquifer from Pre-development to 2008 Values >1 indicate head is below the 80% criterion
Groundwater Storage Calculations Loss of compressible storage within calculation area Expressed as a percent of storage available above 80% criterion levels September, 2011
Simulated Water Levels Aquifer: Piney Point Scenario : 3 Mode : Steady State End Date : - Pumping : Permitted VA Wells - Reported 2008 rates (90.4 Mgal/d) Franklin Wells - Reported 2008 rates (33.3 Mgal/d) Water Level Ft (MSL) > 160 140 to 160 120 to 140 100 to 120 80 to 100 60 to 80 40 to 60 20 to 40 0 to 20 -20 to 0 -40 to -20 -60 to -40 -80 to -60 -100 to -80 -120 to -100 -140 to -120 -160 to -140 < -160 • Notes: • NC and MD wells at 2005 rates • Estimated domestic withdrawals at 2008 rates • Water levels vertically averaged over full aquifer thickness • Permitted VA wells include Franklin wells 80% Criterion Violations Dewatered Cells 20’ contour September, 2011
Simulated Water Levels Aquifer: Aquia Scenario : 3 Mode : Steady State End Date : - Pumping : Permitted VA Wells - Reported 2008 rates (90.4 Mgal/d) Franklin Wells - Reported 2008 rates (33.3 Mgal/d) Water Level Ft (MSL) > 160 140 to 160 120 to 140 100 to 120 80 to 100 60 to 80 40 to 60 20 to 40 0 to 20 -20 to 0 -40 to -20 -60 to -40 -80 to -60 -100 to -80 -120 to -100 -140 to -120 -160 to -140 < -160 • Notes: • NC and MD wells at 2005 rates • Estimated domestic withdrawals at 2008 rates • Water levels vertically averaged over full aquifer thickness • Permitted VA wells include Franklin wells 80% Criterion Violations Dewatered Cells 20’ contour September, 2011
Simulated Water Levels Aquifer: Potomac Scenario : 3 Mode : Steady State End Date : - Pumping : Permitted VA Wells - Reported 2008 rates (90.4 Mgal/d) Franklin Wells - Reported 2008 rates (33.3 Mgal/d) Water Level Ft (MSL) > 160 140 to 160 120 to 140 100 to 120 80 to 100 60 to 80 40 to 60 20 to 40 0 to 20 -20 to 0 -40 to -20 -60 to -40 -80 to -60 -100 to -80 -120 to -100 -140 to -120 -160 to -140 < -160 • Notes: • NC and MD wells at 2005 rates • Estimated domestic withdrawals at 2008 rates • Water levels vertically averaged over full aquifer thickness • Permitted VA wells include Franklin wells 80% Criterion Violations Dewatered Cells 20’ contour September, 2011
Simulated Water Levels Aquifer: Piney Point Scenario : 4 Mode : Steady State End Date : - Pumping Rates : Permitted VA Wells - Total Permitted 2005 (165.5 Mgal/d) Franklin Wells - Total Permitted 2005 (37.8 Mgal/d) Water Level Ft (MSL) > 160 140 to 160 120 to 140 100 to 120 80 to 100 60 to 80 40 to 60 20 to 40 0 to 20 -20 to 0 -40 to -20 -60 to -40 -80 to -60 -100 to -80 -120 to -100 -140 to -120 -160 to -140 < -160 • Notes: • NC and MD wells at 2005 rates • Estimated domestic withdrawals at 2008 rates • Water levels vertically averaged over full aquifer thickness • Permitted VA wells include Franklin wells 80% Criterion Violations Dewatered Cells 20’ contour September, 2011
Simulated Water Levels Aquifer: Aquia Scenario : 4 Mode : Steady State End Date : - Pumping Rates : Permitted VA Wells - Total Permitted 2005 (165.5 Mgal/d) Franklin Wells - Total Permitted 2005 (37.8 Mgal/d) Water Level Ft (MSL) > 160 140 to 160 120 to 140 100 to 120 80 to 100 60 to 80 40 to 60 20 to 40 0 to 20 -20 to 0 -40 to -20 -60 to -40 -80 to -60 -100 to -80 -120 to -100 -140 to -120 -160 to -140 < -160 • Notes: • NC and MD wells at 2005 rates • Estimated domestic withdrawals at 2008 rates • Water levels vertically averaged over full aquifer thickness • Permitted VA wells include Franklin wells 80% Criterion Violations Dewatered Cells 20’ contour September, 2011
Simulated Water Levels Aquifer: Potomac Scenario : 4 Mode : Steady State End Date : - Pumping Rates : Permitted VA Wells - Total Permitted 2005 (165.5 Mgal/d) Franklin Wells - Total Permitted 2005 (37.8 Mgal/d) Water Level Ft (MSL) > 160 140 to 160 120 to 140 100 to 120 80 to 100 60 to 80 40 to 60 20 to 40 0 to 20 -20 to 0 -40 to -20 -60 to -40 -80 to -60 -100 to -80 -120 to -100 -140 to -120 -160 to -140 < -160 • Notes: • NC and MD wells at 2005 rates • Estimated domestic withdrawals at 2008 rates • Water levels vertically averaged over full aquifer thickness • Permitted VA wells include Franklin wells 80% Criterion Violations Dewatered Cells 20’ contour September, 2011
Pre-Development Flow ~ Potomac Aquifer CRATER 0 FT 140 FT
Post-Development Flow (2003) ~ Potomac Aquifer -180 FT CRATER 0 FT -180 FT
Saltwater Intrusion – Water Quality Changes McFarland, 2010, USGS Professional Paper 1772
Saltwater Intrusion Space / Time Relations HAMPTON ROADS FRANKLIN WEST POINT EPISODIC CONTINUOUS YEARS-DECADES UPCONING WEEKS-MONTHS REVERSIBLE LATERAL INTRUSION CENTURIES VERTICAL SCALE GREATLY EXAGGERATED
Groundwater Storage Calculation Drawdown Ft (MSL) For each model cell, changes in compressible storage are calculated by: Change in Storage = Specific Storage x Cell Volume x Change in Water Level Aquifer compaction and land subsidence are not simulated. • 100’ drawdown contour in the Potomac aquifer • defines area for storage calculations > 160 140 to 160 120 to 140 100 to 120 80 to 100 60 to 80 40 to 60 20 to 40 0 to 20 -20 to 0 -40 to -20 -60 to -40 -80 to -60 -100 to -80 -120 to -100 -140 to -120 -160 to -140 < -160 20’ contour September, 2011
Land Subsidence – Relative Sea-Level Rise Rates of Elevation Change (1940-1971) mm/year Holdahl and Morrison, 1974 Measurement of Compaction and Subsidence Suffolk Extensometer June 1982 – Dec. 1995 Depth = 484 m Chesapeake Bay West Point Franklin Extensometer Oct. 1979 – Dec. 1995 Depth = 255 m Major Pumping Centers Suffolk Miles Franklin 0 25
Projected Extent of Subsidence West Point INDUSTRIAL HAMPTON ROADS Franklin Suffolk
Scott Kudlas, Director Office of Surface and Ground Water Supply Planning (804) 698-4456 scott.kudlas@deq.virginia.gov http://www.deq.virginia.gov/watersupplyplanning/homepage.html