Understanding Probability and Parameters in Sociology
450 likes | 539 Vues
Explore probability concepts, cross tabulations, parameters, and statistics in sociology. Understand randomness and probability math in different scenarios. Learn about voting statistics and population distributions.

Understanding Probability and Parameters in Sociology
E N D
Presentation Transcript
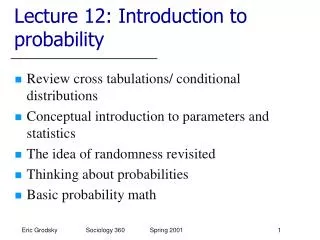
Lecture 12: Introduction to probability • Review cross tabulations/ conditional distributions • Conceptual introduction to parameters and statistics • The idea of randomness revisited • Thinking about probabilities • Basic probability math Eric Grodsky Sociology 360 Spring 2001 1
Race and affirmative action • favor aff | • action in | race • hiring | white black other | Total • -------------+---------------------------------+---------- • str support | 57 94 9 | 160 • | 4.48 44.34 11.25 | 10.24 • -------------+---------------------------------+---------- • some support | 77 27 8 | 112 • | 6.06 12.74 10.00 | 7.17 • -------------+---------------------------------+---------- • oppose | 335 43 24 | 402 • | 26.36 20.28 30.00 | 25.72 • -------------+---------------------------------+---------- • str oppose | 802 48 39 | 889 • | 63.10 22.64 48.75 | 56.88 • -------------+---------------------------------+---------- • Total | 1271 212 80 | 1563 • | 100.00 100.00 100.00 | 100.00 Eric Grodsky Sociology 360 Spring 2001 2
Aid support by income quartile • low-income | income category • co | Q1 Q2 Q3 Q4 | Total • -----------+--------------------------------------------+---------- • def shd | 144 149 114 132 | 539 • | 34.95 34.33 33.04 32.04 | 33.62 • -----------+--------------------------------------------+---------- • prob shd | 213 232 182 216 | 843 • | 51.70 53.46 52.75 52.43 | 52.59 • -----------+--------------------------------------------+---------- • prob not | 40 43 35 47 | 165 • | 9.71 9.91 10.14 11.41 | 10.29 • -----------+--------------------------------------------+---------- • def not | 15 10 14 17 | 56 • | 3.64 2.30 4.06 4.13 | 3.49 • -----------+--------------------------------------------+---------- • Total | 412 434 345 412 | 1603 • | 100.00 100.00 100.00 100.00 | 100.00 Eric Grodsky Sociology 360 Spring 2001 3
Parameters and statistics • A parameter is the true population value for some attribute • May be an attribute of a distribution (such as mean, median, variance) • May be an attribute of a relationship (correlation, least squares regression line) Eric Grodsky Sociology 360 Spring 2001 4
Assumptions • When we talk about a parameter, we are assuming: • The quantity exists in real life (empirical) • The quantity is stable, at least for a moment • The quantity is knowable • These assumptions are not universally accepted Eric Grodsky Sociology 360 Spring 2001 5
Measuring net worth • The parameter of interest is mean net worth in the population of those over age 18 in the U.S. In 1990 • There is an average net worth out there • It is stable at a particular moment • It is a knowable quantity Eric Grodsky Sociology 360 Spring 2001 6
Voting for president • Percent of “likely voters” supporting each candidate (October 11-13) • Bush 48% • Gore 44% • Nader 2% • Buchanan 1% Eric Grodsky Sociology 360 Spring 2001 7
Assumptions on voting • The parameters are percentage of the voting population voting for each candidate. The assumptions are: • There is an actual percentage out there • It is stable at a particular moment • It is a knowable quantity Eric Grodsky Sociology 360 Spring 2001 8
The internet stamp tax • In a debate in the fall of 2000, Rick Lazio and Hillary Clinton were asked to share their views on a House bill to allow the U.S. Postal Service to tax email at 5¢ a pop • The bill is fictitious- an internet hoax • Assume we asked Americans about their views on this bill Eric Grodsky Sociology 360 Spring 2001 9
The internet tax question • Recently, the U.S. House of Representatives took up a bill that would tax email at 5¢ a message. Would you say you strongly oppose, somewhat oppose, somewhat favor, or strongly favor this legislation? Eric Grodsky Sociology 360 Spring 2001 10
Assumptions on the internet tax • The parameters are percentage of the population strongly opposed, somewhat opposed, somewhat in favor and strongly in favor of the bill. The assumptions are: • There is an actual percentage out there • It is stable at a particular moment • It is a knowable quantity Eric Grodsky Sociology 360 Spring 2001 11
Statistics and parameters • A statistic is your best guess at the value of a parameter; your attempt to infer the parameter’s value • We are almost always interested in parameters (properties of a population), but choose to estimate those parameters from samples • This applies to both experimental and observational studies Eric Grodsky Sociology 360 Spring 2001 12
Population and theoretical distributions • There is a connection between population distributions and theoretical distributions • Though we believe there are population distributions, we seldom if ever observe them • Population and theoretical distribution share the same notation Eric Grodsky Sociology 360 Spring 2001 13
Some (old) new notation • It is important to distinguish between sample and population distributions • So important we use different symbols Eric Grodsky Sociology 360 Spring 2001 14
How are statistics and parameters related? • If a statistic is calculated from data from a simple random sample, the distribution of the statistic has a known relationship to the population parameter. • By building on chance, on probability, we can make claims concerning the parameters in which we are interested. Eric Grodsky Sociology 360 Spring 2001 15
Randomness revisited • To say something is random is to say that the outcome or value of something cannot be known with certainty before it is observed • This is very different from saying that the distribution of this value is random • Many phenomena are random at one level (individual observations), but follow a pattern at another level (aggregations) Eric Grodsky Sociology 360 Spring 2001 16
The coin toss example • Heads or tails is the outcome of each trial (flip of the coin) • Assuming the coin is balanced, as the number of tosses increases, the proportion of heads approaches 0.50 Eric Grodsky Sociology 360 Spring 2001 17
The coin toss example Eric Grodsky Sociology 360 Spring 2001 18
To find probability, you must: • Have a long series of independent trials • Observe and record the outcomes of those trials • Aggregate across trials to find the probability Eric Grodsky Sociology 360 Spring 2001 19
The voting example • Think of each observation as a trial • The responses are Bush, Gore, Nader or Buchanan • Observations are independent if: • probability of selection for each sample member is independent • interviewer and response are independent Eric Grodsky Sociology 360 Spring 2001 20
The voting example • In simulated data, I gave each observation a 44% probability of choosing Gore. • The following graphs plot the proportion of observations voting for Gore by the number of observations • This is analogous to the number of successes (or failures) by the number of trials Eric Grodsky Sociology 360 Spring 2001 21
Voting with 200 observations Eric Grodsky Sociology 360 Spring 2001 22
Voting with 2000 observations Eric Grodsky Sociology 360 Spring 2001 23
Probability math • A probability model describes a random phenomenon, or a random event. Probability models begin with: • The sample space (S), which is the set of all possible outcomes • The event, which is any outcome or set of outcomes of interests • A way of assigning probabilities Eric Grodsky Sociology 360 Spring 2001 24
The sample space • Think of a sample space as a population of outcomes. All possible outcomes are included. • The number of possible outcomes varies with the number of trials Eric Grodsky Sociology 360 Spring 2001 25
Coin toss S={heads, tails} Voter poll S={Bush, Gore, Nader, Buchanan} Examples of sample space: one observation Eric Grodsky Sociology 360 Spring 2001 26
Coin toss S={heads tails heads heads tails heads tails tails} Voter poll S={Bush Bush Nader Nader Bush Gore Nader Bush Bush Nader Nader Gore Bush Buchanan Nader Buchanan Gore Gore Buchanan Buchanan Gore Bush Buchanan Bush Gore Nader Buchanan Gore Gore Buchanan Buchanan Nader} Examples of sample space: two observations, order counts Eric Grodsky Sociology 360 Spring 2001 27
Coin toss S={heads tails heads heads tails tails} Voter poll S={Bush Bush Nader Nader Bush Gore Bush Nader Bush Buchanan Nader Buchanan Gore Gore Buchanan Buchanan Gore Nader Gore Buchanan } Examples of sample space: two observations, order doesn’t count Eric Grodsky Sociology 360 Spring 2001 28
Coin toss (number of heads) S={0,1,2,3,4,5,6,7,8,9,10} Voter poll (votes for Bush) S={0,1,2,3,4,5,6,7,8,9,10} Sample space, one outcome of interest, 10 trials Eric Grodsky Sociology 360 Spring 2001 29
The event • An event is a sample of outcomes, a subset of interest to us. Not a random sample, a subset. • If order counts, event might be “getting heads first, tails second” • If order does not count, event might be “getting one heads and one tails” • The sample space and event depend on the research question Eric Grodsky Sociology 360 Spring 2001 30
Properties of probability • Probability is the likelihood of some event occurring • Any probability is between 0 and 1 • 0P(A) 1 • 0P(vote Nader) 1 Eric Grodsky Sociology 360 Spring 2001 31
Properties of probability • The sum of probabilities for all possible outcomes is 1 • P(S)=1 • P(Nader or Bush or Gore or Buchanan or other)=1 Eric Grodsky Sociology 360 Spring 2001 32
Properties of probability • The probability that an event does not occur is 1 minus the probability that an event does occur • P(not A)=1-P(A) • P(not Nader)=1-P(Nader) Eric Grodsky Sociology 360 Spring 2001 33
Properties of probability • It two events A and B have no outcomes in common, the probability of either event occurring is sum of probabilities of A and B. • P(A or B)=P(A) + P(B) • P(Nader or Buchanan)= P(Nader) + P(Buchanan) • If the above is true, we call A and B disjoint events Eric Grodsky Sociology 360 Spring 2001 34
Probabilities and frequencies • Probability and frequency are closely related logically and mathematically • The relative frequency for some event in a population is the probability of that event • The relative frequency of some event in a sample is an estimate of the population probability Eric Grodsky Sociology 360 Spring 2001 35
Who supports aid for college? • low-income | race of respondent • co | white black other | Total • -----------+---------------------------------+---------- • def shld | 386 113 40 | 539 • | 29.09 57.95 49.38 | 33.62 • -----------+---------------------------------+---------- • pr shld | 739 73 31 | 843 • | 55.69 37.44 38.27 | 52.59 • -----------+---------------------------------+---------- • pr not | 153 6 6 | 165 • | 11.53 3.08 7.41 | 10.29 • -----------+---------------------------------+---------- • def not | 49 3 4 | 56 • | 3.69 1.54 4.94 | 3.49 • -----------+---------------------------------+---------- • Total | 1327 195 81 | 1603 • | 100.00 100.00 100.00 | 100.00 Eric Grodsky Sociology 360 Spring 2001 36
Assigning probabilities • Sometimes it is useful to assign probabilities rather than observing them • Simulations (such as the voting analysis) • Sampling • When we assign probabilities, we often do so using random draws from a density curve Eric Grodsky Sociology 360 Spring 2001 37
Uniform distribution (empirical) Eric Grodsky Sociology 360 Spring 2001 38
Simulating voting • In this case, 44% of “likely voters” in the Gallup poll preferred Gore, 48% preferred Bush • Assign voters to Bush if P(X).44 • Assign voters to Gore if .44<P(X) .92 Eric Grodsky Sociology 360 Spring 2001 39
Sampling voting • Assign likely voters equal (uniform) probabilities of selection • Select voters at random • Observe their voting preferences • In this case, 44% of “likely voters” in the Gallup poll preferred Gore, 48% preferred Bush Eric Grodsky Sociology 360 Spring 2001 40
In both cases… • Whether or not individual i prefers Gore, Bush, Nader or Buchanan is a random variable • In the simulation, observations are randomly assigned to a candidate • In the survey, observations have views and are randomly selected Eric Grodsky Sociology 360 Spring 2001 41
Random variables • “A random variable is a variable whose value is a numerical outcome of a random phenomenon” (Moore, p. 231) • Not completely random • Not necessarily mostly random • Just needs a random component Eric Grodsky Sociology 360 Spring 2001 42
Probability distributions • The probability distribution of a random variable X shows us the values X can take • There are many different probability distributions • One with which you are familiar is the normal probability distribution, AKA “Table A” Eric Grodsky Sociology 360 Spring 2001 43
Next time • The normal probability distribution and • The sampling distribution which is NOT an empirical distribution Eric Grodsky Sociology 360 Spring 2001 44
Homework due Wednesday, March 28 • Moore: 4.10,18,20,32,35,40,42,43,54 Eric Grodsky Sociology 360 Spring 2001 45