Download
1 / 20
200 likes | 323 Vues
Learn about Geographic Information Systems (GIS) and how they are used for community development, mapping data, and analyzing spatial relationships for better decision-making.

E N D
What does GIS stand for? • Geographic Information Systems • often defined as a computerized database management system for capture, storage, retrieval, analysis, and display of spatial data. - www.cml.upenn.edu/what_is_gis.htm • Sometimes referred to as method of digital mapping that links data to it’s physical location.
How GIS works • GIS breaks anything that has a geographic location into: • Vector Data: • Points - GPS points, address points, tree locations, etc. • Lines – rivers, railroads, streets, corridors, etc. • Polygons – political boundaries, lakes, building footprints, etc. Image ource: www.esri.com 2013
How GIS Works • Features are stored as layers and are layered on top of the first one to show spatial patterns and relationships Image source: www.esri.com 2013
GIS is in reality nothing more than a large database with a geographic component. The power behind GIS is in the attributes attached to the features...allows for more complex analysis based on more than just geographic location.
Why Use GIS? • Layer the different datasets to do geographic analysis (analysis based on geographic location) • Map Where Things Are – parks, sidewalks, groceries, bus stops • Map Quantities - population • Map Densities – population density (how many people per square mile) • Find What’s Inside – How many people (groceries, parks, trails) inside a neighborhood (town, county, study area). • Find What’s Nearby – How many bus stops (green spaces, crimes) are located or were reported within a 10 minute walking distance of a neighborhood (school, store, university) • Map Change – urban sprawl, zoning changes source: www.esri.com 2013
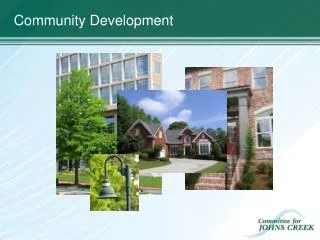
Why Use GIS for Community Development? • To show relationships among several factors or issues within a community. • To show you where to concentrate your efforts. • To better understand the community you are working in by providing a picture of the area’s assets or weaknesses. • Because it’s fast: GIS is the quickest and most efficient method of creating maps and graphics that provide a picture of not only the geographic, but of the social, demographic, environmental, political, and other aspects of an area as well. • GIS maps make powerful presentation tools. • GIS maps can help influence policy. Source: KU Work Group for Community Health and Development. (2014). Chapter 3, Section 10: Conducting Concerns Surveys. Lawrence, KS: University of Kansas. Retrieved January 2, 2014, from the Community Tool Box: http://ctb.ku.edu/en/table-of-contents/assessment/assessing-community-ne...
Who Uses GIS? • Government Agencies (from small municipalities to federal government) • Health and Human Services Agencies • Community Involvement Groups (i.e.., watch dog groups, activists, advocates) • Environmental Agencies • Researchers and Educators • Policy Makers and Community Developers • Corporations and Firms Source: KU Work Group for Community Health and Development. (2014). Chapter 3, Section 10: Conducting Concerns Surveys. Lawrence, KS: University of Kansas. Retrieved January 2, 2014, from the Community Tool Box: http://ctb.ku.edu/en/table-of-contents/assessment/assessing-community-ne...
Data • What makes data “spatial”? • Must have a geographic component • Address • Lat/Long coordinates • Tied to a location such as a state, city, region, service area, census block. • When should you create and share maps of your data? • Only if it enhances the data and makes it easier for users to understand and comprehend!! • A picture is worth a thousand words!
Your Data • GPS • Georeferencing - a historic map or image • Geocoding addresses • Heads-up-digitizing • Analysis tools with GIS software • Mobile mapping – cellphones, tablets • Upload from a database (Excel, Access, etc.) • Stream from Twitter or other social media
Online Data and Mapping: • Local County GIS offices • IndianaMap (or other state clearinghouse) • Census.gov (google “American Factfinder”) • Indiana Spatial Data Portal • SAVI (IUPUI Polis Center) • Census.gov • The National Map • National Historic GIS – historic census data in a GIS format. • HUD.gov • NOAA • Community Commons • Center for Disease Control (CDC)
Esri ArcGIS Desktop Free Version: ArcGIS Explorer Desktop: http://www.esri.com/software/arcgis/explorer-desktop
Local County GIS Websites http://beacon.schneidercorp.com/Default.aspx
IndianaMap http://www.indianamap.org/
Stats Indiana http://www.stats.indiana.edu/maptools/interactive.asp
Community Commons http://www.communitycommons.org/maps-data/
Google Maps Create and share maps in a matter of minutes by uploading your own database with records tied to a location (address, lat/long). http://maps.google.com
ArcGIS Online ArcGIS.com - http://www.arcgis.com/home/gallery.html Upload your own data, or create it in ArcGIS Online, user data created and shared by others, create map applications and share and/or embed on your own webpage. Thousands of user created datasets to choose from. Free and subscription versions available. Image source: www.esri.com 2013
QUESTIONS? Contact: Angela Gibson GIS Specialist Ball State University Libraries GIS Research and Map Collection asgibson2@bsu.edu 285-1097