Download
1 / 35
350 likes | 443 Vues
Learn about the knowledge gap between scientists and policymakers regarding climate change, including the danger of tipping points and the impact on global sea levels. Explore the risks of a 'different planet' scenario and methods to reduce CO2 emissions for a sustainable future.

E N D
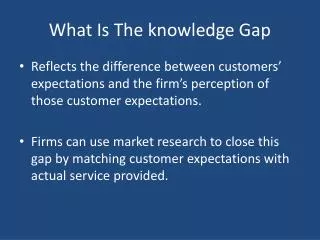
Status of the Matter 1. A Knowledge Gap - What is Understood (scientists) - What is Known (public/policymakers) 2. The Climate Crisis - Positive Feedbacks Predominate - Climate Inertia Pipeline Effect Danger:Tipping PointDifferent Planet
CO2, CH4 and temperature records from Antarctic ice core data Source:Vimeux, F., K.M. Cuffey, and Jouzel, J., 2002, "New insights into Southern Hemisphere temperature changes from Vostok ice cores using deuterium excess correction", Earth and Planetary Science Letters, 203, 829-843.
Ice Age Forcings Imply Global Climate Sensitivity ~ ¾°C per W/m2. Source: Hansen et al., Natl. Geogr. Res. & Explor., 9, 141, 1993.
CO2,CH4 and estimated global temperature (Antarctic ΔT/2 in ice core era) 0 = 1880-1899 mean. Source: Hansen, Clim. Change, 68, 269, 2005.
Proxy record of Plio-Pleistocene (3.5 million years) temperature and ice volume. Based on oxygen isotope preserved in shells of benthic (deep ocean dwelling) foraminifera.
Metrics for “Dangerous” Change Extermination of Animal & Plant Species 1. Extinction of Polar and Alpine Species 2. Unsustainable Migration Rates Ice Sheet Disintegration: Global Sea Level 1. Long-Term Change from Paleoclimate Data 2. Ice Sheet Response Time Regional Climate Disruptions 1. Increase of Extreme Events 2. Shifting Zones/Freshwater Shortages
Arctic Climate Impact Assessment (ACIA) Sources: Claire Parkinson and Robert Taylor
Survival of Species 1. “Business-as-Usual” Scenario - Global Warming ~ 3ºC - Likely Extinctions ~ 50 percent 2. “Alternative” Scenario - Global Warming ~ 1ºC - Likely Extinctions ~ 10 percent Climate Feedbacks Scenario Dichotomy
2002 all-time record melt area • Melting up to elevation of 2000 m • 16% increase from 1979 to 2002 70 meters thinning in 5 years Increasing Melt Area on Greenland Satellite-era record melt of 2002 was exceeded in 2005. Source: Waleed Abdalati, Goddard Space Flight Center
Surface Melt on Greenland Melt descending into a moulin, a vertical shaft carrying water to ice sheet base. Source: Roger Braithwaite, University of Manchester (UK)
Jakobshavn Ice Stream in Greenland Discharge from major Greenland ice streams is accelerating markedly. Source: Prof. Konrad Steffen, Univ. of Colorado
Summary: Ice Sheets 1. Human Forcing Dwarfs Paleo Forcing and Is Changing Much Faster 2. Ice Sheet Disintegration Starts Slowly but Multiple Positive Feedbacks Can Lead to Rapid Non-Linear Collapse 3. Equilibrium Sea Level Rise for ~3C Warming (25±10 m = 80 feet) Implies the Potential for Us to Lose Control
Atmospheric CO2 measured at Mauna Loa, Hawaii. Source: NOAA Climate Monitoring and Diagnostic Laboratory
CO2 airborne fraction, i.e., ratio of annual atmospheric CO2 increase to annual fossil fuel CO2 emissions. Source: Hansen and Sato, PNAS, 101, 16109, 2004.
Status of CO2 Pre-industrial Amount: 280 ppm Present Amount: 382 ppm Maximum Allowable ≤ 450 ppm Rate of Change: +2 ppm/year (and growing) Maximum Likely To Be Exceeded ‘Geoengineering’ May Be Needed!
Science & Implications 1. Warming >1°C Risks ‘Different Planet’ - Maximum CO2 ~450 ppm (maybe less!) - CO2 limit slightly more, if non-CO2↓ 2. Quarter of CO2 Stays in Air “Forever” - Eventual Vehicles must be Zero-CO2 (renewable, hydrogen from nuclear or solar, etc.) - Eventual Power Plants must be Zero-CO2 3. Gas + Oil Use Most of 450 ppm Limit - Coal/unconventional must sequester CO2 - Gas + Oil supplies must be stretched
Methods to Reduce CO2 Emissions 1.Energy Efficiency & Conservation More Efficient Technology Life Style Changes 2.Renewable & CO2-Free Energy Hydro Solar, Wind, Geothermal Nuclear 3.CO2 Capture & Sequestration No Silver Bullet All Three are Essential
Outline of Solution 1. Coal only in Powerplants w Sequestration Phase-out old technology. Timetable TBD 2. Stretch Conventional Oil & Gas Via Incentives (Carbon tax) & Standards No Unconventional F.F. (Tar Shale, etc.) 3. Reduce non-CO2 Climate Forcings Methane, Black Soot, Nitrous Oxide 4. Draw Down Atmospheric CO2 Agricultural & Forestry Practices Biofuel-Powered Power-Plants