Download
1 / 143
1.43k likes | 1.59k Vues
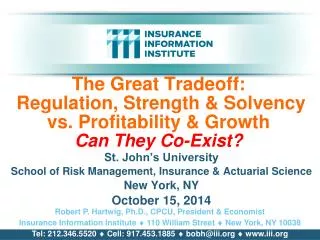
The Great Tradeoff: Regulation, Strength & Solvency vs. Profitability & Growth Can They Co-Exist?. St. John’s University School of Risk Management, Insurance & Actuarial Science New York, NY October 15, 2014. Robert P. Hartwig, Ph.D., CPCU, President & Economist

E N D
The Great Tradeoff: Regulation, Strength & Solvencyvs. Profitability & GrowthCan They Co-Exist? St. John’s University School of Risk Management, Insurance & Actuarial Science New York, NY October 15, 2014 Robert P. Hartwig, Ph.D., CPCU, President & Economist Insurance Information Institute 110 William Street New York, NY 10038 Tel: 212.346.5520 Cell: 917.453.1885 bobh@iii.org www.iii.org
Presentation Outline PART I: PROFITABILITY • A History of Insurance Industry Profitability • Can financial strength and robust profitability co-exist? • Supply, Demand and Alternative “Capital” • When Profits Suffer, Who Is to Blame? • 7 Leading Contenders: The “Fall Guys” • Is the Insurance Industry Becoming Less Risky? • Since when? Why? • Comparison with Banks PART II: GROWTH • A Global History & Overview of Growth • Pockets and Waves of Growth • Narrowing the “Underinsurance Gap” • Growth through Consolidation? • Q&A eSlide – P6466 – The Financial Crisis and the Future of the P/C
PART I: PROFITABILITYHas Strength Come at the Expense of Performance? What Can History Tell Us? 3
What Is Happening to Insurer Profitability? What Can We Learn from History? Déjà Vu: Cycles or Super-Cycles? 4
P/C Industry Net Income After Taxes1991–2014* Net income rose strongly (+81.9%) in 2013 vs. 2012 on lower cats, capital gains • 2005 ROE*= 9.6% • 2006 ROE = 12.7% • 2007 ROE = 10.9% • 2008 ROE = 0.1% • 2009 ROE = 5.0% • 2010 ROE = 6.6% • 2011 ROAS1 = 3.5% • 2012 ROAS1 = 5.9% • 2013 ROAS1 = 10.3% • 2014 ROAS1 = 7.8%* $ Millions 2014 is off to a slower start • ROE figures are GAAP; 1Return on avg. surplus. Excluding Mortgage & Financial Guaranty insurers yields a 7.7% ROAS through 2014:Q2, 9.8% ROAS in 2013, 6.2% ROAS in 2012, 4.7% ROAS for 2011, 7.6% for 2010 and 7.4% for 2009. 2014 is annualized H1 data. • Sources: A.M. Best, ISO; Insurance Information Institute
RNW All Lines by State, 2003-2012 Average:Highest 25 States The most profitable states over the past decade are widely distributed geographically, though none are in the Gulf region Source: NAIC; Insurance Information Institute.
RNW All Lines by State, 2003-2012 Average: Lowest 25 States Some of the least profitable states over the past decade were hit hard by catastrophes Source: NAIC; Insurance Information Institute.
P/C Insurance Industry Combined Ratio, 2001–2014:H1* Higher CAT Losses, Shrinking Reserve Releases, Toll of Soft Market Relatively Low CAT Losses, Reserve Releases As Recently as 2001, Insurers Paid Out Nearly $1.16 for Every $1 in Earned Premiums Heavy Use of Reinsurance Lowered Net Losses Relatively Low CAT Losses, Reserve Releases Avg. CAT Losses, More Reserve Releases Sandy Impacts Best Combined Ratio Since 1949 (87.6) Cyclical Deterioration Lower CAT Losses * Excludes Mortgage & Financial Guaranty insurers 2008--2014. Including M&FG, 2008=105.1, 2009=100.7, 2010=102.4, 2011=108.1; 2012:=103.2; 2013: = 96.1; 2014:H1 = 98.9. Sources: A.M. Best, ISO. eSlide – P6466 – The Financial Crisis and the Future of the P/C
ROE: Property/Casualty Insurance by Major Event, 1987–2014:H1 (Percent) P/C Profitability Is Both by Cyclicality and Ordinary Volatility Katrina, Rita, Wilma Low CATs Sept. 11 Hugo Lowest CAT Losses in 15 Years 4 Hurricanes Sandy Andrew Record Tornado Losses Northridge Financial Crisis* * Excludes Mortgage & Financial Guarantee in 2008 – 2014. 2014 figure is through H1:2014. Sources: ISO, Fortune; Insurance Information Institute. eSlide – P6466 – The Financial Crisis and the Future of the P/C
Profitability Peaks & Troughs in the P/C Insurance Industry, 1975 – 2014:H1* History suggests next ROE peak will be in 2015-2016 ROE 1977:19.0% 1987:17.3% 10 Years 2006:12.7% 1997:11.6% 2013 10.4% 10 Years 9 Years 2014:H1 7.7% 2001: -1.2% 1975: 2.4% 1984: 1.8% 1992: 4.5% *Profitability = P/C insurer ROEs. 2011-14 figures are estimates based on ROAS data. Note: Data for 2008-2014 exclude mortgage and financial guaranty insurers. Source: Insurance Information Institute; NAIC, ISO, A.M. Best.
P/C Insurance ROE as 5-Year Moving Average After smoothing, there is a more evident trend toward lower profitability The Tradeoff: Industry impairment rates have plunged Source: Jessica Weinkle, Insurance Journal, “An Average Perspective Based Insurance Profitability Cycles,” October 6, 2014, based om I.I.I. data, http://www.insurancejournal.com/magazines/closingquote/2014/10/06/342096.htm. eSlide – P6466 – The Financial Crisis and the Future of the P/C
P/C Insurance ROE Index(1974-2014:Q1 = 100) Lower profitability seems to be the norm after 1994. Is RBC a cause? Greater use of modeling? The Tradeoff: Industry impairment rates have plunged Source: Jessica Weinkle, Insurance Journal, “An Average Perspective Based Insurance Profitability Cycles,” October 6, 2014, based om I.I.I. data, http://www.insurancejournal.com/magazines/closingquote/2014/10/06/342096.htm. eSlide – P6466 – The Financial Crisis and the Future of the P/C
Back to the Future: Profitability Peaks & Troughs in the P/C Insurance Industry, 1950 – 2014* 1970-90: Peak ROEs were much higher in this period while troughs were comparable. High interest rates, rapid inflation, economic volatility all played roles ROE 1990-2010s: Déjà vu. Excluding mega-CATs, this period is very similar to the 1950-1970 period 1950-70: ROEs were lower in this period. Low interest rates, low inflation, “Bureau” rate regulation all played a role 1977:19.0% 1987:17.3% 2006:12.7% 1972:13.7% 1997:11.6% 2013 10.4% 1950:8.0% 1966-67: 5.5% 1959:6.8% 2014:H1 7.7% 1969: 3.9% 1992: 4.5% 1984: 1.8% 1975: 2.4% 1965: 2.2% 1957: 1.8% 2001: -1.2% *Profitability = P/C insurer ROEs. 2011-14 figures are estimates based on ROAS data. Note: Data for 2008-2014 exclude mortgage and financial guaranty insurers. 2014 figure is through Q2. Source: Insurance Information Institute; NAIC, ISO, A.M. Best.
Average ROE for the P/C Insurance Industry by Decade, 1950s – 2010s Profitability peaked in the 1970s and 1980s but has tapered off since then Average Annual Percent Change (%) P/C profitability was much lower in the 1960s and 1970s Profitability Has Declined since the highs of the 1970s and 1980s, but is above that of the 1950s and 1960s Sources: Insurance Information Institute research. 14 12/01/09 - 9pm eSlide – P6466 – The Financial Crisis and the Future of the P/C
A 100 Combined Ratio Isn’t What ItOnce Was: Investment Impact on ROEs A combined ratio of about 100 generates an ROE of ~7.0% in 2012/13, ~7.5% ROE in 2009/10,10% in 2005 and 16% in 1979 Combined Ratio / ROE Lower CATs helped ROEs in 2013 Combined Ratios Must Be Lower in Today’s DepressedInvestment Environment to Generate Risk Appropriate ROEs * 2008 -2014 figures are return on average surplus and exclude mortgage and financial guaranty insurers. 2014:H1 combined ratio including M&FG insurers is 98.9; 2013 = 96.1; 2012 =103.2, 2011 = 108.1, ROAS = 3.5%. Source: Insurance Information Institute from A.M. Best and ISO Verisk Analytics data.
BANK LESSON: Profitability, Capital and Systemically Important Banks Global Systemically Important bank Tier-1 capital ratios are up since the global financial crisis, but ROEs are lower The Message from Regulators: Get used to it! Source: The Economist, “No Respite,” September 27, 2014. eSlide – P6466 – The Financial Crisis and the Future of the P/C
Who’s to Blame for the Decline in Peak P/C Profitability? The 7 “Fall Guys” 18
#1 Mother Nature Profits in the Age of Mega CATs 19
Natural Disasters in the United States, 1980 – 2013Number of Events (Annual Totals 1980 – 2013) There were 128 natural disaster events in 2013 Number 22 19 81 6 Meteorological (storm) Climatological (temperature extremes, drought, wildfire) Geophysical (earthquake, tsunami, volcanic activity) Hydrological (flood, mass movement) Source: MR NatCatSERVICE 21
Combined Ratio Points Associated with Catastrophe Losses: 1960 – 2013* Avg. CAT Loss Component of theCombined Ratio by Decade 1960s: 1.04 1970s: 0.85 1980s: 1.31 1990s: 3.39 2000s: 3.52 2010s: 6.1E* Catastrophe losses as a share of all losses reached a record high in 2012 Combined Ratio Points The Catastrophe Loss Component of Private Insurer Losses Has Increased Sharply in Recent Decades *2010s represent 2010-2013. Notes: Private carrier losses only. Excludes loss adjustment expenses and reinsurance reinstatement premiums. Figures are adjusted for losses ultimately paid by foreign insurers and reinsurers. Source: ISO (1960-2011); A.M. Best (2012E) Insurance Information Institute.
Top 16 Most Costly Disastersin U.S. History (Insured Losses, 2013 Dollars, $ Billions) Superstorm Sandy in 2012 was the last mega-CAT to hit the US Includes Joplin, MO, tornado Includes Tuscaloosa, AL, tornado 12 of the 16 Most Expensive Events in US History Have Occurred Over the Past Decade (2004-2013) Sources: PCS; Insurance Information Institute inflation adjustments to 2013 dollars using the CPI.
#2 Wall Street Crashes, Interest Rates & General Volatility 24
S&P 500 Index Returns, 1950 – 2014* Volatility is endemic to stock markets—and may be increasing—but there is no persistent downward trend over long periods of time ROE 2014:H1 7.7% Fed Raises Rate Tech Bubble Implosion Financial Crisis Energy Crisis *Through Oct. 12, 2014. Source: NYU Stern School of Business: http://pages.stern.nyu.edu/~adamodar/New_Home_Page/datafile/histretSP.html Ins. Info. Inst.
P/C Insurer Net Realized Capital Gains/Losses, 1990-2013 Realized capital gains rose sharply as equity markets rallied ($ Billions) Insurers Posted Net Realized Capital Gains in 2010 - 2013 Following Two Years of Realized Losses During the Financial Crisis. Realized Capital Losses Were aPrimary Cause of 2008/2009’s Large Drop in Profits and ROE Sources: A.M. Best, ISO, Insurance Information Institute. 26 12/01/09 - 9pm eSlide – P6466 – The Financial Crisis and the Future of the P/C
Property/Casualty Insurance Industry Investment Income: 2000–20141 Investment earnings are still below their 2007 pre-crisis peak ($ Billions) Due to persistently low interest rates,investment income fell in 2012 and in 2013and is falling again in 2014. 1Investment gains consist primarily of interest and stock dividends. *2014 figure is estimated based on annualized H1 data. Sources: ISO; Insurance Information Institute.
Property/Casualty Insurance Industry Investment Gain: 1994–20131 ($ Billions) Investment gains in 2013 were their highest in the post-crisis era Investment Income Continued to Fall in 2013 Due to Low Interest Rates but Realized Investment Gains Were Up Sharply; The Financial Crisis Caused Investment Gains to Fall by 50% in 2008 1 Investment gains consist primarily of interest, stock dividends and realized capital gains and losses. * 2005 figure includes special one-time dividend of $3.2B; Sources: ISO; Insurance Information Institute.
#3 The Federal Reserve Do Fed Rates Actions Help or Hurt P/C Insurers? 29
U.S. Treasury Security Yields:A Long Downward Trend, 1990–2014* Yields on 10-Year U.S. Treasury Notes have been essentially below 5% for a full decade. U.S. Treasury yields plunged to historic lows in 2013. Longer-term yields have rebounded a bit. Since roughly 80% of P/C bond/cash investments are in 10-year or shorter durations, most P/C insurer portfolios will have low-yielding bonds for years to come. *Monthly, constant maturity, nominal rates, through July 2014. Sources: Federal Reserve Bank at http://www.federalreserve.gov/releases/h15/data.htm. National Bureau of Economic Research (recession dates); Insurance Information Institute. 30 12/01/09 - 9pm eSlide – P6466 – The Financial Crisis and the Future of the P/C
Reduction in Combined Ratio Necessary to Offset 1% Decline in Investment Yield to Maintain Constant ROE, by Line* Lower Investment Earnings Place a Greater Burden on Underwriting and Pricing Discipline *Based on 2008 Invested Assets and Earned Premiums **US domestic reinsurance only Source: A.M. Best; Insurance Information Institute. 31 12/01/09 - 9pm eSlide – P6466 – The Financial Crisis and the Future of the P/C
#4 The Economy Do Variability and Volatility in the Economy Make Earning Reasonable ROEs More Difficult? 32
US Real GDP Growth* The Q4:2008 decline was the steepest since the Q1:1982 drop of 6.8% Real GDP Growth (%) Recession began in Dec. 2007. Economic toll of credit crunch, housing slump, labor market contraction was severe Q1 2014 GDP data were hit hard by this year’s “Polar Vortex” and harsh winter Demand for Insurance Should Increase in 2014/15 as GDP Growth Accelerates Modestly and Gradually Benefits the Economy Broadly * Estimates/Forecasts from Blue Chip Economic Indicators. Source: US Department of Commerce, Blue Economic Indicators 9/14; Insurance Information Institute.
Impairments vs. Real GDP Growth, P/C & L/H, 1978-2013 Insurers are more resilient to economic volatility than in the past. That improvement began well before Dodd-Frank No. of Impairments Real GDP Growth Today, impairment rates seem less sensitive to economic downturns Historically, there has been a lagged, inverse relationship between GDP growth and impairments Very few impairments *US P/C and L/H companies, 1977-2013. Sources: A.M. Best: Best’s Impairment Rate and Rating Transition Study—1977-2013, March 31, 2014; Insurance Information Institute.
Downgrade/Upgrade Ratio vs. Real GDP Growth, P/C & L/H, 1978-2013 Downgrades tend to fall relative to upgrades as the economy improves Ratio of Downgrades to Upgrades Increase in downgrade/upgrade ratio was smaller in Great Recession than past recessions, suggesting greater resilience Real GDP Growth Historically, there has been a lagged, inverse relationship between GDP growth and impairments *US P/C and L/H companies, 1977-2013. Sources: A.M. Best: Best’s Impairment Rate and Rating Transition Study—1977-2013, March 31, 2014; Insurance Information Institute.
Number of Recessions Endured by P/C Insurers, by Number of Years in Operation Number of Recessions Since 1860 Insurers are true survivors—not just of natural catastrophes but also economic ones Number of Years in Operation Many US Insurers Are Close to a Century Old or Older Sources: Insurance Information Institute research from National Bureau of Economic Research data. 36 12/01/09 - 9pm eSlide – P6466 – The Financial Crisis and the Future of the P/C
#5 The President (of the United States) How Is Profitability Affected by the President’s Political Party? 37
P/CInsurance Industry ROE by Presidential Administration, 1950-2014* OVERALL RECORD: 1950-2014* Democrats 7.72% Republicans 7.85% Party of President has marginal bearing on profitability of P/C insurance industry *Truman administration ROE of 6.97% based on 3 years only, 1950-52; Estimated ROE for 2014 = 7.8% based on data through 2014:Q2. Source: Insurance Information Institute
P/Cinsurance Industry ROE by Presidential Party Affiliation, 1950- 2014* BLUE = Democratic PresidentRED = Republican President Nixon/Ford Obama Reagan/Bush I Bush II Clinton Carter Truman Eisenhower Kennedy/ Johnson Estimated ROE for 2014 = 7.8% based on data through 2014:Q2. Source: Insurance Information Institute
#6 Ratings Agencies Quasi-Regulators Must Have Some Impact 40
P/C Insurer Impairments, 1969–2013 Impairments among P/C insurers remain infrequent The Number of Impairments Varies Significantly Over the P/C Insurance Cycle, With Peaks Occurring Well into Hard Markets Source: A.M. Best Special Report “U.S. P/C Impairments Down Sharply in 2013; Alternative Risk Players Faltered,” June 23, 2014; Insurance Information Institute.
P/C Insurer Impairment Frequency vs. Combined Ratio, 1969-2013 2013 impairment rate was 0.43%, down from 0.76% in 2012; the rate is lower than the 0.81% average since 1969 Impairment Rates Are Highly Correlated With Underwriting Performance and Reached Record Lows in 2007; Recent Increase Was Associated Primarily With Mortgage and Financial Guaranty Insurers and Not Representative of the Industry Overall Source: A.M. Best; Insurance Information Institute
Reasons for US P/C Insurer Impairments, 1969–2013 Historically, Deficient Loss Reserves and Inadequate Pricing AreBy Far the Leading Cause of P-C Insurer Impairments. Investment and Catastrophe Losses Play a Much Smaller Role Reinsurance Failure Sig. Change in Business Misc. Investment Problems (Overstatement of Assets) Deficient Loss Reserves/Inadequate Pricing Affiliate Impairment Leading causes of death (reserves and growth) are generally under the control of insurers Catastrophe Losses Alleged Fraud Rapid Growth Source: A.M. Best Special Report “U.S. P/C Impairments Down Sharply in 2013; Alternative Risk Players Faltered,” June 23, 2014; Insurance Information Institute.
P/C Reserve Development, 1992–2015E P/C reserve development is clearly cyclical Note: 2005 reserve development excludes a $6 billion loss portfolio transfer between American Re and Munich Re. Including this transaction, total prior year adverse development in 2005 was $7 billion. The data from 2000 and subsequent years excludes development from financial guaranty and mortgage insurance. Sources: A.M. Best, ISO, Barclays Research (estimates for 2013-2015).
Rapid Growth ‘A Leading Cause’ of Impairment’ “The leading causes of impairment are deficient loss reserves (inadequate pricing) and rapid growth, together comprising more than 50 percent of annual impairments.” - A.M. Best, 2013 Source: SNL Financial, Insurance Information Institute.
Top 10 Lines of Business for US P/C Impaired Insurers, 1969–2013 Workers Comp and Pvt. Passenger Auto Account for Nearly 45 Percent of the Impaired Insurers Since 1969 Other Mortgage & Financial Guaranty Workers Comp Title WC accounts for only about 9% of all premiums written but 17% of premium of impaired insurers, whereas PPA accounts for 37% of all premiums but only 26% of impaired insurer premiums Surety Medical Prof. Liability Other Liability Pvt. Passenger Auto Commercial Auto Liability Commercial Multiperil Homeowners Source: A.M. Best Special Report “U.S. P/C Impairments Down Sharply in 2013; Alternative Risk Players Faltered,” June 23, 2014; Insurance Information Institute.
Cumulative Average Impairment Ratesby A.M. Best Financial Strength Rating* Insurers with strong ratings are far less likely to become impaired (fail) over long periods of time. Note: The cumulative likelihood of impairment has been falling uniformly across the 15-year time horizon for all but the riskiest (lowest rated) riskiest insurers. This suggests that insurers have become less risky over the past several years. *US P/C and L/H companies, 1977-2013. Sources: A.M. Best: Best’s Impairment Rate and Rating Transition Study—1977-2013, March 31, 2014; Insurance Information Institute.
#7 Regulators Is an Increased Regulatory Burden Reducing ROEs? 49
Is There Evidence that the (Re) Insurance Industry Is Becoming Less Risky Is Boring Better? 50
Policyholder Surplus, 2006:Q4–2014:H1 Drop due to near-record 2011 CAT losses ($ Billions) 2007:Q3Pre-Crisis Peak Surplus as of 6/30/14 stood at a record high $671.6B The industry now has $1 of surplus for every $0.73 of NPW,close to the strongest claims-paying status in its history. 2010:Q1 data includes $22.5B of paid-in capital from a holding company parent for one insurer’s investment in a non-insurance business . The P/C insurance industry entered 2014in very strong financial condition. Sources: ISO, A.M .Best. 51 12/01/09 - 9pm eSlide – P6466 – The Financial Crisis and the Future of the P/C
US Policyholder Surplus:1975–2014* ($ Billions) Surplus as of 6/30/14 was a record $671.6, up 2.8% from $653.3 of 12/31/13, and up 53.6% ($234.5B) from the crisis trough of $437.1B at 3/31/09 “Surplus” is a measure of underwriting capacity. It is analogous to “Owners Equity” or “Net Worth” in non-insurance organizations The Premium-to-Surplus Ratio Stood at $0.73:$1 as of6/30/14, aNear Record Low (at Least in Recent History) * As of 6/30/14. Source: A.M. Best, ISO, Insurance Information Institute.
Premium-to-Surplus Ratio:1985–2014* (Ratio of NWP to PHS) The larger surplus is in relation to premiums—the lower the P:S ratio—and the great the industry’s capacity to handle the risk it has accepted Surplus as of 6/30/14 was $0.73:$1, a record low (at least in modern history) 9/11, Recession & Hard Market The Premium-to-Surplus Ratio Stood at $0.73:$1 as of6/30/14, a Record Low (at Least in Recent History) * As of 6/30/14. Source: A.M. Best, ISO, Insurance Information Institute.