Download
1 / 44
440 likes | 486 Vues
This training workshop module covers practical aspects of managing water resource systems, including defining operating rules, practical considerations, and group discussions. Examples demonstrate implementing hydro-power operating rules, blending rules, and cost-saving measures with decision criteria considerations.

E N D
Training and TechnologyTransfer Workshop 19 & 20 May 2014 Module 4:Management of water resource systems
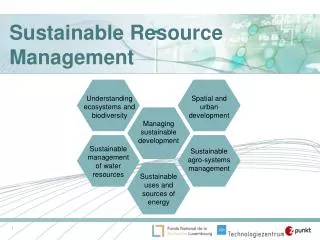
Contents 1. Defining system operating rules 2. Practical considerations 3. Group discussion
Background (1 of 2) • Purpose: To implement rules that will maximize the hydro-power benefit at Gariep & Vanderkloof dams without jeopardizing the assurance of supply to the users. • Decision criteria: Should not have negative impact on long-term and short-term reliability of supply • Example: • Orange River system – Orange River Project • Annual Operating Analyses (2008/09)
Background (2 of 2) • Options investigated: • Reduce non-generating spillage at both dams • Improve monthly distribution pattern of generated energy • Utilise short-term surplus in the system to generate Hydro Power • Methods implemented: • Introduce storage control curves (SCC) • Use mirror image of Vanderkloof release pattern and impose on Gariep releases • Use annual operating analysis (WRPM) to determine short-term surplus or deficit in system.
Short-term surplus ORP • Use Long-term stochastic analysis 1000 sequences of 15 years each constant development level • Use Short-term projection Curtailment criteria violated first time by 2014
Background (1 of 3) • Purpose: Test the possibility of deviating from the long-term blending rule for the purpose of improving, over the short-term, the quality of supplied water. • Decision criteria: Should not have negative impact on long-term reliability of supply • Example: • Integrated Vaal River system • Annual Operating Analyses (2000/01)
Dilution: 450 or 600 mg/l TDS constraint: 300 mg/l Background (2 of 3) • System configuration: Evaporation losses Bloemhof Dam Vaal Barrage Vaal Dam Spillsto d/s Fromu/s Blending Users from Bloemhof Return flow Users along river reach Rand Water demand centre Consumptive use
Background (3 of 3) • Methodology: Analyse various scenarios and compare the relative projected TDS concentrations: • Scenario 1: Long-term rule • Rand Water supplied from Vaal Barrage as priority • Blend with Vaal Dam water to not exceed 300 mg/l • Scenario 2: Revised rule • First 12 months: 600 mg/l dilution in Vaal Barrage and Rand Water supplied from Vaal Dam only • After 12 months revert back to long-term rule
Back to long-term rule Supply from Vaal Dam only Annual average TDSRand water supply(Scenario 2)
Annual average TDSUsers downstream of Vaal Barrage(Scenario 2)
Background (1 of 4) • Purpose: Test the possibility of deviating from the long-term operating rule for the purpose of reducing operating costs. Note: • Can only be applied during periods of high system storage • Decision is based on current system information • Decision criteria: Should not have negative impact on long-term reliability of supply • Example: • Integrated Vaal River system • Annual Operating Analyses (2000/01)
Heyshope- Grootdraai Zaaihoek- Grootdraai Background (2 of 4)
Background (3 of 4) • Methodology: Analyse 2 scenarios and compare the relative projected pumping costs: • Scenario 1: Long-term rule • Transfer until Grootdraai above 90 % of live FSV • Scenario 2: Revised rule • From May 2000 for 12 months • Transfer only until Grootdraai above 75 % of live FSV • After 12 months revert back to long-term rule
Background (4 of 4) • Methodology (cont.): A cost calculation is undertaken as follows: • Run 2 scenarios as previously described • Undertake 1 000 sequences • Multiply unit cost of transfer with transferred volumes, for a single sequence for both scenarios • Calculate difference in cost between two scenarios, for that sequence • Repeat for both transfer links and add results, for that sequence • Repeat for all sequences and derive probability distribution, for both transfer links and for total
Actual projected savingsRevised compared with long-term rule(Over 5-year period) Description of transfer Saving at indicated exceedance probability (%)(1) (X R1 million) 99.5 99 98 95 75 50 25 5 2 1 0.5 Heyshope to Grootdraai Zaaihoek to Grootdraai Total(2) 0.6 (0.5) 0.9 0.8 (0.4) 1.2 1.0 (0.1) 1.8 1.7 0.1 2.8 4.1 1.0 5.7 5.4 1.8 7.3 6.9 2.6 9.1 10.4 3.8 13.1 11.5 4.2 14.7 12.5 4.5 15.8 13.7 5.3 17.4 Notes: (1) Values in brackets indicate a cost increase. (2) Not the sum of columns.
Usutu draw-down sequence Fig 2.1 Inter-reservoir operating rule: Usutu subsystem Morgenstond Dam Westoe Dam Jericho dam Full Supply Level Full Supply Level Full Supply Level 100% 1551.43 100% 1466.41 100% 1384.00 2 1 3 1466.06 94% 85% 1550.09 1371.83 21% 6 5 4 1368.32 10% 7 Dead Storage Level Dead Storage Level Dead Storage Level 1537.50 1457.00 1361.18 Bottom Bottom Bottom 1528.50 1446.00 1350.50 1 = Drawdown sequence
Operational flow decision diagram 1 Yes Max W M >100% Balance M No Yes Max W J >94% Balance J End No Yes Max W M >0 Balance M No Max W Balance J
General aspects • Compare simulated and actual recorded behavior of system variables • Reservoir trajectories • Transfer volumes • Water requirements
Orange Vaal Transfer LHWP Transfer
Simplified curtailment graph (Luvhuvhu, Vondo/Tshakuma system) Low Medium Low Medium High High
Background • Purpose: Identify circumstances in a system warranting the implementation, as well as the lifting of restrictions • Example: • Integrated Vaal River system • 1993 to 1995 • Methodology: Monitor the behaviour of a system by plotting, on the graph of projected system volumes, the actual system volume trajectory
Restrictions lifted Restrictions imposed Historical reservoir levels Levels below which curtailments are imposed
Training and TechnologyTransfer Workshop 19 & 20 May 2014 End of module