GEONETCAST ONGOING 10 day synthesis
60 likes | 194 Vues
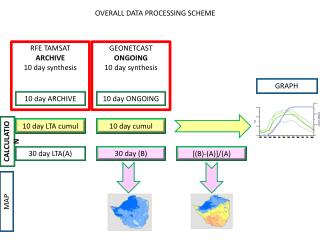
OVERALL DATA PROCESSING SCHEME. RFE TAMSAT ARCHIVE 10 day synthesis. GEONETCAST ONGOING 10 day synthesis. GRAPH. 10 day ARCHIVE. 10 day ONGOING. 10 day LTA cumul. 10 day cumul. CALCULATION. 30 day LTA(A). 30 day (B). [ (B)-(A)]/(A). MAP. Calculation of the Graphs. NDVI and RFE.

GEONETCAST ONGOING 10 day synthesis
E N D
Presentation Transcript
OVERALL DATA PROCESSING SCHEME RFE TAMSAT ARCHIVE 10 day synthesis GEONETCAST ONGOING 10 day synthesis GRAPH 10 day ARCHIVE 10 day ONGOING 10 day LTA cumul 10 day cumul CALCULATION 30 day LTA(A) 30 day (B) [(B)-(A)]/(A) MAP
Calculation of the Graphs NDVI and RFE AREA FRACTION IMAGES (PASTURE &ARABLE LAND) ADMINISTRATIVE AREA X X The AFI is calculated through fishnet from Arc GIS By crossing through “UNION” the Land cover of reference (GLOB COVER, AFRICOVER…) And the Administrative areas. Then they are used by SPIRITS to generte the graphs.
Calculation of the Cluster analysis • NDVI Time Series • Ten day NDVI • Ten day NDVI differences Mask from the AFI (PASTURE &ARABLE LAND) Iso data clustering on the masked NDVI and differences for a predifined nb of classes X
Calculation of the SWB graphs Small Water Body - Ten day occurence AREA FRACTION IMAGES (PASTURE &ARABLE LAND) ADMINISTRATIVE AREA X X SEASON CUMUL MAP The procedure is similar to the NDVI profile but using a counting of SWB pixels instead of average. If there a cloudy pixel in between SWB dekads then it considered as SWB (interpolation over 3 dekads)- Approach to be refined…
Calculation of the anomalies frequency Maps showing the number of time the on going season values were outside the interval: [Mean -/+ n*StDev] per administrative area.
Recapitulation of the inputs/outputs for the different CFSAM report Under refinement