Download
1 / 42
420 likes | 428 Vues
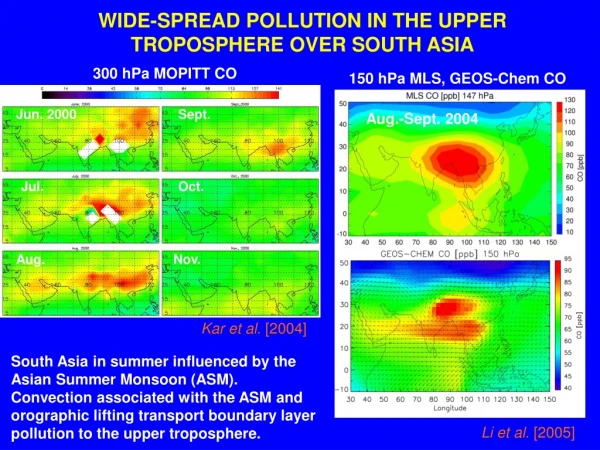
This study examines the sources, transport, and radiative effects of pollution particles in South Asia, focusing on their impact on climate. It analyzes the effects of aerosols on cloud structure, radiation perturbation, and atmospheric heating. The study also discusses the modeling of aerosol formation, transport, and climate effects in the South Asian region.

E N D
Pollution Particles over South Asia: Emission sources, transport and radiative effects Chandra VenkataramanDepartment of Chemical EngineeringIndian Institute of Technology,Bombay, India Collaborators: Shubha Verma,Deep Kadamba - IIT Bombay, India Gazala Habib – University of Illinois, Urbana Champaign Manish Shrivastava – Carnegie Mellon University, USA Olivier Boucher – MetOffice, UKM. Shekar Reddy – NOAA-GFDL, Princeton, USA
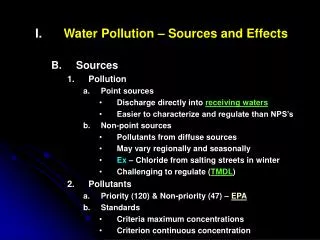
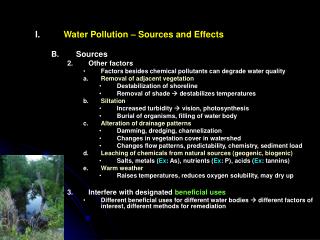
HOW DO ATMOSPHERIC POLLUTANTS AFFECT CLIMATE? Aerosols modify cloud structure. An increase in aerosol number increases cloud reflectivity and reduces cloud lifetime. Net cooling or heating can occur. Cloud condensation nuclei Cloud water CCN Increase in CCN from human emissions of sulphate / organic carbon / ionic aerosols. Natural sources CCN from atm reactions of sulphur compounds from plankton or organic carbon compounds from flora. Gases, like CO2, N2O, CH4 absorb longwave radiation from Earth and capture it as thermal energy in the atmosphere leading to global warming. Scattering aerosols (sulphate, organic carbon, ions/water) reflect radiation, while absorbing aerosols (black carbon, BC) absorb and re-radiate thermal. Net cooling of Earth’s surface, but heating of atmospheric layers with BC.
RADIATION PERTURBATION BY AEROSOLS The change in radiation flux is given by: • n(dp), the particle number distribution, f (RH), # m-3m-1 • Kext, the extinction efficiency • , the radiation wavelength, nm • m, the particle refractive index, real number for pure-scatterers (sulphate) and imaginary number for absorbers (soot), f(RH). • AOD, aerosol optical depth, term on the rhs • “Externally-mixed” or “internally-mixed” aerosol model: • Assumed that aerosols are ensembles of pure particles (soot, sulphate, organic carbon, etc.) and the optical depth from each species is additive or volume-weighted refractive index. • Direct radiative forcing (DRF): • Change in net downward radiative flux resulting from the aerosol optical depth at TOA or Earth’s surface.
4-D pollutant fields, radiative forcing, precipitation, atmosphere and sea surface temperature Climate simulations (campaign mode or long-term) Chemical Transport and General Circulation Model • Emissions: • gases • aerosols • global/gridded Measurements (near- source and remote): -gases / aerosols, -radiation, -climate parameters • Atmospheric sources/ sinks: • gas-phase chemistry • aerosol/cloud chemistry • dry deposition • wet scavenging • Radiation transfer: • -aerosol optical properties f(RH) MODELLING AEROSOL FORMATION, TRANSPORT AND CLIMATE EFFECTS
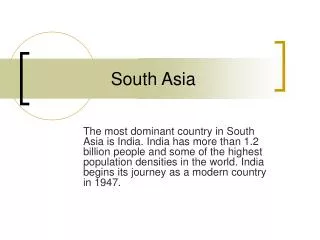
South Asian region BangladeshBhutan India MaldivesNepalPakistan Sri Lanka Population (billions): 2000 : 1.2 (27%) about 1/5 of world 2025 : 2.0 (40%) about 1/4 of world % Urban Population
Indian Ocean Experiment: 1996-1999 Findings • High concentrations of aerosols over the ocean in the boundary layer and at altitudes of 1-3 km. • Large atmospheric heating rate of +20 W m-2 • Large surface cooling rate of –30 W m-2 For reference: global mean greenhouse gas atmospheric heating = +2.5 Wm-2
Species contribution to PM2.5 at KCO (5N, 73.5 E) during Feb. 14-18, 1999 INDOEX-IFP, 1999 AOD@ 500 nm 1996 1997 1998 1999 Sulfate = 40% (FF)Organics = 26% (FF/BB/NAT)BC = 14% (FF) Large inter-annual variations in AOD modulated by emissions/regional meteorology Ramanathan et al., 2002, UNEP
1999 – anomalous forest fires 3 – fold INDOEX IFP 99 2 – fold Average number of fires (arbitrary units) ATSR Forest Fire counts
Biofuels Crop waste open burning Forest burning Fossil fuel BC=400 Ggyr-1 IOM=1760 Ggyr-1 CO2=1915x103 Ggyr-1 OC=1170 Ggyr-1 PM2.5=4320 Ggyr-1 CO=65x103 Ggyr-1 OM=2160 Ggyr-1 SO2=4175 Ggyr-1 IOM BC OC OM PM2.5 CO2 CO SO2 Pollutants 0 10 20 30 40 50 60 70 80 90 100 Relative contribution (%) of sources to pollutant emissions Newly available India / Asia emissions inventories Reddy and Venkataraman, 2002a, b, Atmos Environ; Habib et al., 2004, GBC; Venkataraman et al., 2005a, Science & 2005b, GBC; Habib et al., 2005, in prep.
Black carbon: Industrial fossil fuel BC: 90 Gg y-1 5 25 60 120 250 500 kg km-2 y-1
Fuelwood: 281x103 (Ggy-1) Crop waste Wood Dried cattle manure Kerosene LPG Black carbon: 174 (Ggy-1) (Ggy-1) (Ggy-1) Black carbon: Residential fuel 0.34% 2% 17% 81%
Black carbon: Forest burning BC: 18 Ggy-1 kg km-2 month-1
Black carbon: Crop waste field burning BC: 86 Ggy-1 kg km-2 month-1
Simulations of aerosol transport during the INDOEX-IFP in the LMD-ZT Introduction of multi-component aerosols: sulphate, black carbon, organic matter, fly-ash, dust (<1µm; 1-10µm) and sea-salt (8 size bins). India emissions at 0.25ox0.25o with ground level and elevated sources (MSR/CV 2002a, b). Asia emissions (Streets et al. 2003). Nudged to ECMWF winds from Nov 1998 to March 1999. Parameterisation for carbonaceous aerosolgrowth from hydrophobic to hydrophilic state. Wavelength dependent aerosol optical properties at different relative humidity. Zoom to 0.47 x 0.47 deg resolution over INDOEX domain and 19 vertical layers or high resolution with 50 vertical layers. Reddy et al., 2004, JGR; Verma et al., 2005, JGR.
Location of measurements Coastal plane Transverse plane Kaashidhoo
Spatial variability of chemical species Sulphate BC Ron Brown cruise track Organic matter Fly-ash Sea-salt
Aerosol optical depth: METEOSAT versus model
Questions • BC emissions in inventory: strongly underestimated from S. Asia? • Surface concentrations and column loading: which species dominate? • Geographical origin of INDOEX aerosols: proximate sources or long-range transport? • Source of carbonaceous aerosols: biomass or fossil fuels? • Large-scale advection of elevated aerosols: mechanisms of lofting and channels of outflow?
Are South Asia BC emissions too low? aModel aerosol SSAs were averaged only for days for which AERONET retrievals are available. Single Scatter Albedo = (1-αabs)/αext BC from South Asia (SA): CNTRL exp. : 0.55 Tg 2xBC exp. : 1.10 Tg Suggested 2-3 Tg of BC from SA wouldresult in SSA of ~0.6 over source regions and ~0.7-0.8 at KCO.
Which species dominate optical depth? Sulphate contribution to AOD (%) 50 40 30 20 10 1 Organic matter contribution to AOD (%)
How absorbing is the aerosol? Single scatter albedo SSA = (1-αabs)/αext 0.99 0.95 0.9 0.87 BC contribution to AOD (%) 50 40 30 20 10 1
Role of Fly-ash Annual emissions are about 1.5 Tg yr-1 from India, predominantly from coal-based power plants. % Contribution to visible AOD during Jan.-Mar. Surface concentration (μg m-3)
Sulphate South Asia contribution - sulphate SurfaceConcentration AOD
Black carbon Organic matter South Asia contribution - carbon SurfaceConc AOD Elevated plumes from Africa contributed significantly to carbonaceous aerosol loads over the Indian Ocean.
Biofuels Crop waste open burning Forest burning Fossil fuel BC=400 Ggyr-1 IOM=1760 Ggyr-1 CO2=1915x103 Ggyr-1 OC=1170 Ggyr-1 PM2.5=4320 Ggyr-1 CO=65x103 Ggyr-1 OM=2160 Ggyr-1 SO2=4175 Ggyr-1 IOM BC OC OM PM2.5 CO2 CO SO2 Pollutants 0 10 20 30 40 50 60 70 80 90 100 Relative contribution (%) of sources to pollutant emissions Biomass burning as an emission source Reddy and Venkataraman, 2002a, b, Atmos Environ; Habib et al., 2004, GBC; Venkataraman et al., 2005a, Science & 2005b, GBC; Habib et al., 2005, in prep.
Biomass contribution to atmospheric BC+OM Surface concentration (μg m-3) Column Burden (g m-2) (%) (%)
Contribution of “biofuels” BC burden (%) Courtesy M. Shekar Reddy - Bond et al., 2004 inventory in the GFDL-GCM: [Note: about 20% of “biofuel” use is industrial] Account for 13% of global BC Emissions of 11 Tg yr-1. Contribution to annual mean BC burden and DRF (direct radaitive forcing): - 12% globally - 25-50% parts of S. and E. Asia Effect on climate? - needs long-term simulations including climate feedback All sky DRF at TOA by BC (%)
Mechanisms of aerosol lofting Feb Mar 1000 hPa 12 GMT Surface winds m s-1 Vertical velocity Pa s-1
Location of measurements Coastal plane Transverse plane Kaashidhoo
Regions of maximum updraft – coastal plane, 12 GMT 140 km Vertical velocity Pa s-1
Horizontal and vertical extent of sea-breeze: transverse plane, 12 GMT 80 km Vertical velocity Pa s-1
Organic matter isosurface – 2 g m-3 Channels of outflow
Aerosol vertical profiles on the coastal plane during sea and land breeze March 21-25, 1999 Sea breeze Land breeze 140 km μg m-3
Time series in wind direction at Goa: ECMWF and LMDZT Wind direction: from N - 0 deg from E - 90 deg from S - 180 degfrom W - 270 deg GCM ECMWF Sea breeze Land breeze
Aerosol vertical structure at Hulule Lidar Model
Assumed AOD representative of 1990. The seasonal variation in AOD and SSA is not represented. Climate impacts of black carbon from Asia Single Scatter Albedo SSA = (1-αabs)/αext CNNRL-EXPA1990: AOD; SSA=0.85 Would represent extreme scenario(s)?? CNNRL-EXPB1990: AOD; SSA=1.0 Menon, S., Hansen, J. et al., 2002, Science
Prescribed INDOEX atmospheric heating rates and sea surface temperatures. Climate impact of “INDOEX” haze Ramanathan et al., 2002, UNEP Report
Some answers • BC emissions from S. Asia are not under-represented in proportion to scattering aerosols. • Carbonaceous aerosols dominate regional aerosol loading, followed by sulphate and fly-ash. • SAARC emissions dominate regional sulphate. • SAARC emissions are an important but not dominant source of carbon (30-60% of surface concentrations and 20-50% of AOD). • Significant contribution of biofuels and open biomass burning to carbonaceous aerosol burden and radiative forcing. • Sea-breeze mediates aerosol lofting on west coast during the NE monsoon. • Channels of outflow from central India can affect elevated aerosol features 700 km downwind.
Future directions • Seasonal and interannual variability in aerosol transport and loading, and radiative effects. • Linking anthropogenic aerosol load to economic sectors / technologies and assessment of technology substitution. • Strategies to leverage climate benefits from regional air resources management. • Effects of long range transport on Indian region air quality and climate.