Download
1 / 16
160 likes | 251 Vues
Understand statistical measures like mean, median, mode, variance, standard deviation, and outliers in data analysis. Learn how to calculate using calculator commands and interpret normal distribution curves. Differentiate between biased and unbiased samples.

E N D
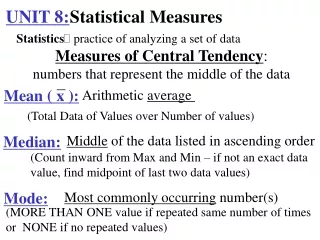
Mean ( x ): UNIT 8:Statistical Measures Statistics practice of analyzing a set of data Measures of Central Tendency: numbers that represent the middle of the data Arithmetic average (Total Data of Values over Number of values) Middle of the data listed in ascending order Median: (Count inward from Max and Min – if not an exact data value, find midpoint of last two data values) Mode: Most commonly occurring number(s) (MORE THAN ONE value if repeated same number of times or NONE if no repeated values)
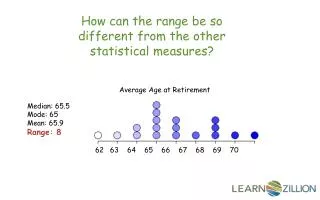
Measures of Variation: Variance, Standard Deviation Dispersion: How spread / scattered a set of data is Range: Difference between the highest and lowest data value (MAX – MIN) Inner Quartile Range (IQR): The difference between Q3 and Q1 (Q3 – Q1) Outlier: Any data item outside Q1 or Q3 a distance 1.5*IQR *Standard Deviation (σ): A measure of how much the data is spread out **We don’t use variance** Variance (σ2 ): Measures how much the data differs from the mean
5 Number Summary: Min: Minimum Value (0 Percentile) Q1: Quartile 1 (25th Percentile) Med (Q2): Median (50th Percentile) Q3: Quartile 3 (75th Percentile) Max: Maximum or Q4 (100th Percentile) Min Med Max Q1 Q2 Q3 Q4
Calculator Commands:One-Variable Statistics • Input data: [STAT] [EDIT] L1 • [STAT] → [CALC] → [1: 1-Var STATS] • σx→ represents standard deviation • = represents mean • n = number of entries • med= median • Etc…
Ex: Find the mean, median, mode, and standard deviation of … (2) GPAs: 3.42, 3.91, 3.33, 3.57, 3.45, 4.0, 3.65, 3.71, 3.35, 3.82, 3.67, 3.88, 3.76, 3.41, 3.62 (1)Test Scores: 85, 76, 88, 91, 85, 58, 88, 91, 97, 91, 88, 97, 97 • Mean = • Median = • Mode = • Stand. Deviation = • Mean = • Median = • Mode = • Stand. Deviation =
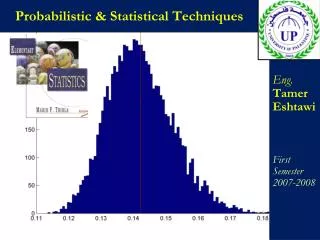
Normal Distribution Mean = Median “Bell Curve” Skewed data is described based on location of tail Positively Skewed (Right) “Mean is to Right of Median” Negatively Skewed (Left) “Mean is to Left of Median”
Normal Distribution:68 – 95 – 99 Rule 13.5% 34% 34% 13.5% 2% 2% 0.5% 0.5% σ= Standard Deviation _____of values are 1 st. deviation from the mean: 1 _____of values are 2 st. deviation from the mean: 2 3 _____of values are 3 st. deviation from the mean:
3 7 11 15 19 23 27 (# wrong) Normal Distribution Curve #1:The number of problems missed on a quiz follows a normal distribution with a mean of 15 and a standard deviation of 4.Draw a normal distribution for number of problems missed.
Related Questions: What percent of students missed between 11 – 19 problems? What percent of students missed more than 23 problems? What percent of students less than 23 problems? What percent of students missed fewer than 3 problems? What percent of students missed less than 11 problems?
(score) Normal Distribution Curve #2:The final exam scores normal distribution with a mean of 80 and a standard deviation of 6.Draw a normal distribution for number of problems missed.
Related Questions: What percent of students scored between 80 - 92? What percent of students scored between 68 -86? What percent of students scored less than 98? What percent of students scored higher than 74? What percent of students scored less than 80?
Normal Distribution Curve #3:The class mean of height is 60 inches. We know that 68% of the students are between 56 and 64 inches. 1) What is the standard deviation? 2) 50% of the students are shorter than …?3) 16% of students are taller than …?4) 2.5% of students are shorter than…? 5) 84% of students are taller than …?
Biased vs Unbiased • When you are sampling a section of the population (giving a poll), there are good and bad ways to do it. • An unbiased sampleis one in which a good section of the population is represented. • Entire population is well represented • A biased sampleis one in which the sample does not adequately represent the population. • A group or section of population is targeted or missing The bigger the sample, the more accurate the results(larger samples more closely reflect the population).
Determine if situation would produce (un)biased sample: • Ex. 1: You want to determine how many people in a school are going to college, so you ask every third person in an AP Calculus class. • Ex 2: You want to find out people’s favorite kind of food, so you ask 100 people at the food court at the mall. • Ex 3: Putting the names of all the seniors in a hat, then drawing names from the hat to select a sample of seniors. • Ex 4: Determining the shopping preferences of the students at your school by asking people at the mall. • Ex 5: Finding the average height of the students in your school by using the members of the football team.
The Margin of Sampling Error (ME)is a numerical way to determine the difference between how a sample and the population responds. • If prepresents the percentage of people with a particular response from a sample of npeople, then 95% of the time the population will respond within one MEof the response p (p – ME or p + ME)
Exp 1:1500 people were asked a question and 38% responded “yes”. the margin of error (ME) is • That means that there is a 95% chance that the people in the population that would answer “Yes” between Exp 2:. p = 16%, n = 400 Exp 3: 934 out of the 2150 students said they read the newspaper every day