Download

1 / 12
120 likes | 222 Vues
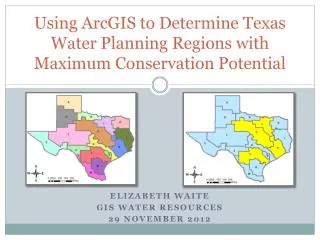
This study by Elizabeth Waite explores strategies for enhancing water conservation in Texas amidst alarming projections, including a potential doubling of the population by 2060 and a corresponding rise in municipal water demand by 3.5 million acre-feet annually. Using data from the 2012 State Water Plan, the analysis identifies planning regions with the greatest conservation potential, considering factors like population and water needs. Key findings emphasize the importance of conservation strategies in metropolitan areas and stress the necessity for continued development of effective management plans.

E N D
Using ArcGIS to Determine Texas Water Planning Regions with Maximum Conservation Potential Elizabeth Waite GIS Water Resources 29 November 2012
Scary Facts Population in Texas is expected to double by 2060 Municipal water demand in Texas could increase by 3.5 million acre-ft per year by 2060 Limited funding is available for meeting these demands
Prepare! Increase Supply! New Surface Reservoirs Groundwater Conjunctive Use Desalination Bush Control Aquifer Storage & Recovery Reuse Decrease Demand! • Conservation
Objective Use data from 2012 State Water Plan to determine Water Planning Regions with the largest potential to conserve.
Data Collection • 2012 State Water Plan of Texas • Texas Water Development Board • Regional Water Planning Groups • Data Collected: • Population Projections • Water Need Projections • Capital Costs • Management Strategies • Conservation • New Reservoirs
Methodology • Import Data Tables • Join tables as appropriate
Methodology Create Layers from Tables Population Water Need Conservation New Reservoirs Cost
Methodology Feature to Raster Conversion Feature Raster Feature to Raster Conversion for 2060 Projected Water Need per Planning Region
Methodology Raster Calculator Population Cost Conservation Water Need New Reservoirs
Results Regions of High Conservation Potential: • Region C • Region G • Region H • Region L
Conclusions & Next Steps Conservation potential greatest in planning regions with large metropolitan areas. Further work needs to be done to create & implement suitable conservation management plans.
Questions? Elizabeth Waite elizabethwaite@utexas.edu