Comprehensive Space Data Acquisition Plan for Mission Coordination and Enhancement Strategies
160 likes | 266 Vues
This document outlines the Space Data Coordination Group's efforts to compile and visualize mission planning tables in a uniform format. It provides a year-by-year overview of national and regional mission availability, enabling effective gap analysis and the development of mitigation plans. The tables cover all GFOI countries, sorted by geographical groups and pertinent to ecosystem regions. Detailed recommendations for agencies include suggestions for improved intra-annual data sharing and revisions to reflect temporal observation frequency for optimized understanding of mitigation strategies.

Comprehensive Space Data Acquisition Plan for Mission Coordination and Enhancement Strategies
E N D
Presentation Transcript
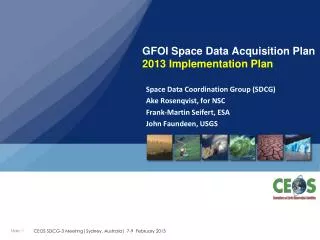
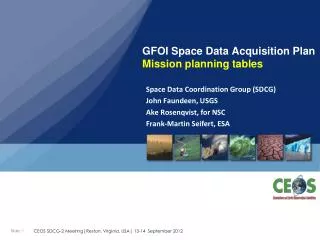
GFOI Space Data Acquisition Plan Mission planning tables Space Data Coordination Group (SDCG) John Faundeen, USGS AkeRosenqvist, for NSC Frank-Martin Seifert, ESA
Mission planning tables Mission tables – a planning tool • Effort to compile complex and diverse mission information in a uniform format • Synoptic overview of national/regional mission availability year-by-year • Visualisation of the “business-as-usual” observation plans and dedicated campaigns for each mission (note: only regional-scale wall-to-wall observations included) • Key tool for gap analysis and development of mitigation plans
Mission planning tables Geographical coverage • Tables currently cover all countries (GFOI) • Sorted into geographical groups which correspond to (coarse) ecosystem regions • Labeled in accordance with GFOI expansion plans • GEO FCT National Demonstrators • REDD+ and UN-REDD participating countries • REDD+ and UN-REDD candidate/observer countries • Others (Annex-1 countries and others)
Type 1: Mission Capacity Overview • “Sensor vs. country” • No intra-annual information (seasonal time windows, observation frequency etc.)
Type 1: Mission Capacity Overview Mission Capacity Overview 2012
Type 1: Mission Capacity Overview Mission Capacity Overview 2013
Type 1: Mission Capacity Overview Mission Capacity Overview 2014
Type 1: Mission Capacity Overview Mission Capacity Overview 2015
Type 1: Mission Capacity Overview Mission Capacity Overview 2015 • Feed-back obtained from all agencies • Verification of table content still required for a few missions • Lack of intra-annual information (especially obs frequency) falsely leads to an overly positive impression of the situation – everything is green! • All-country display cumbersome (current focus on GFOI countries)
Type 1: Mission Capacity Overview Mission Capacity Overview 2015 • Suggest to modify table • Include temporal observation frequency information by use of colour codes • Information can be easily ingested to e.g. COVE for graphical visualisation of annual coverage by mission and by country/region (by CEOS Plenary) • Reduce coverage to pan-tropical zone
Type 2: Mission Specific Info Table type 2: Mission Specific 2012 Radarsat-2
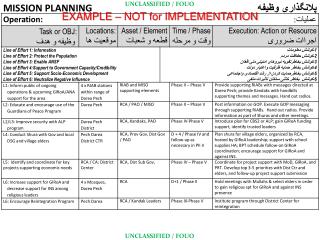
Type 2: Mission Specific Info • Requested for core missions only • Detailed mission specific data: • intra-annual information for each country/region (i.e. seasonal time windows, observation frequency) • Observation modes (specifically for SAR) • Desired for full understanding of how mitigation plans can be optimised • However – Few agencies able to provide this level of detail
Type 2: Mission Specific Info • Tables suitable format for mitigation plans to agencies, but too detailed as input from agencies – at least at this stage. • Suggestion: • Agencies provide info if/when available • Collapse temporal detail (2 weeks 4 quarters (seasonal) • Reduce coverage to pan-tropical zone
Suggested Actions • Revision of mission tables as outlined • All agencies to review current tables (during SDCG-2) and provide additional information (# obs/region/year) required for possible demo at CEOS Plenary