Node-Attribute Graph Layout for Small-World Networks
This study explores innovative graph layout methods tailored for small-world networks, emphasizing node attributes such as age and location. We analyze the limitations of traditional force-directed algorithms, particularly the 'giant hairball' problem. By employing dimension reduction techniques and targeted projection pursuit (TPP), we aim to improve visual analytics in network representation, facilitating better understanding of connectivity and structure. Through practical examples in social and biological networks, we highlight how these advanced visualizations enhance data interpretation in real-world applications.

Node-Attribute Graph Layout for Small-World Networks
E N D
Presentation Transcript
Node-Attribute Graph Layout for Small-World Networks Helen Gibson Principal Supervisor: Dr. Paul Vickers 1st Supervisor: Dr. Maia Angelova 2nd Supervisor: Dr.FouadKhelifi Previous Supervisor: Dr. Joe Faith
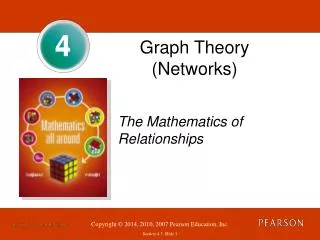
What is a Graph? Relationships between concepts Mathematics and Graph Theory Information Visualisation Graph Drawing Network Visualisation Network Graph
Examples Social Networks http://on.fb.me/hy6dmb World Wide Web http://datamining.typepad.com/gallery/blog-map-gallery.html Biological Networks http://circos.ca IP Addresses https://www.fractalus.com/steve/stuff/ipmap/ http://visualcomplexity.com
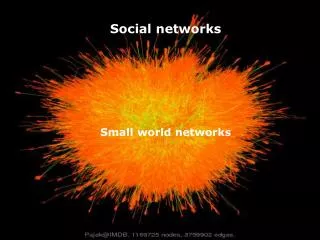
What’s the Problem? It looks nice but is it doing anything useful? Typical complaint: Giant-Hairball Caused by force-directed algorithms Old, but still popular and most commonly used Connected nodes attract, other repel Yeast interaction network in Gephi
How Can This Be Solved? Node Attributes Example – Social Network Node = People Links = Friendships Attributes = age, gender, location, games they interact with, pages they had liked etc. Typical Usage – As retinal variables Use to tell us more information about the graph Uses beyond retinal variables?
Research Aims Novel graph layout based on node-attributes Many node attributes -> use a dimension reduction technique Visual analysis of graphs Visual Analytics - the science of analytical reasoning facilitated by interactive visual interfaces. [Thomas and Cook, 2005] To further understand the connectivity and structure of the graph
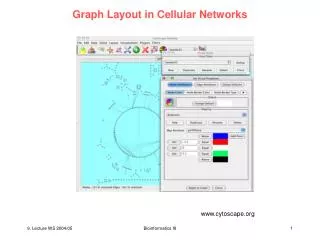
Node-Attributes to Dimensions Attributes as a second set of links Nodes Attributes Each attribute node is a dimension and existence of a link is a value for that dimension on that node
Dimension Reduction and TPP In visualisation: • Many variables form a high-dimensional space reduce to 2 or 3 dimensions that can be seen on a display. • Linear projections Projection Pursuit: • Finds the most ‘interesting’ projection • Interestingness depends on the data Targeted Projection Pursuit (TPP): • Interactive • Searches for a projection closest to a users desired view • In following case, separation of the clusters as far as possible.
Small-World Networks Networks that are: • Highly clustered • Smaller than average shortest path length • An Example: • 4 clusters • Small nodes are attributes Clustering – users’ most valued layout feature
Comparison Force-Directed Graph+TPP
What’s Next? ‘How much better is the clustering?’ Real world domain applications What do we learn about the data from the layout? Evaluation
Publications Gibson, H. (2010) Data-driven layout for the visual analysis of networks. GROUP28: The XXVIII International Colloquium on Group-Theoretical Methods in Physics. Newcastle-upon-Tyne, July 2010. Poster presentation. Gibson, H. , Faith, J. (2011) Node-attribute graph layout for small-world networks. 15th International Conference on Information Visualisation. London, July 2011