Download
1 / 40
400 likes | 558 Vues
METOC Metrics Overview. Tom Murphree and David Meyer Naval Postgraduate School (NPS) murphree@nps.edu Bruce Ford and Manuel Avila Clear Science, Inc. (CSI) bruce@clearscienceinc.com Paul Vodola, Matt McNamara, Luke Piepkorn, and Ed Weitzner Systems Planning and Analysis (SPA)

E N D
METOC Metrics Overview Tom Murphree and David Meyer Naval Postgraduate School (NPS) murphree@nps.edu Bruce Ford and Manuel Avila Clear Science, Inc. (CSI) bruce@clearscienceinc.com Paul Vodola, Matt McNamara, Luke Piepkorn, and Ed Weitzner Systems Planning and Analysis (SPA) pvodola@spa.com Presented at MIW METOC Metrics Symposium CNMOC, Stennis Space Center, MS 01 February 2008 1 Ford B and T. Murphree, ASW Metrics ,08, Jan 08, bruce@clearscienceinc.com, murphree@nps.edu
METOC Metrics: Key Concepts • Metrics • Objective, quantitative measures of an organization’s performance and • impacts. • MIW METOC Metrics Project • Design a system for generating metrics for METOC support of MIW. • Improve our ability to determine how well we support MIW operations, and • how we can do better. • METOC Community Goals • Increase our understanding of, and ability to predict, the environment • Use our knowledge of the environment to increase warfighter effectiveness • Project Impacts • Monitor our progress toward both of METOC community goals • Identify specific methods for improving our progress 2 ASW METOC Metrics Overview, Jan 08, murphree@nps.edu
METOC Metrics: Key Concepts The Motivation for METOC Metrics “Our leaders don’t want to hear how important it is to describe the environment, or to provide accurate information. Rather, they want to hear how our ‘enabling capabilities’ translate into speed, access, or persistence – how our skills result in advantages in force posture (having the right assets in the right place at the right time for optimal effect), fewer ships sunk, more enemy killed, fewer Blue Force casualties, less time spent in harm’s way, more accurate placement of munitions, etc.” RADM Tomaszeski Oceanographer of the Navy Naval Oceanography Program Status Report 2005 3 ASW METOC Metrics Overview, Jan 08, murphree@nps.edu
METOC Metrics: Key Concepts • MIW METOC Metrics • Objective, quantitative measures of the performance and operational impacts of CNMOC products* provided to ASW decision makers. • Operational Value of METOC Metrics • Identify strengths and weaknesses in METOC support*. • Evaluate new products, including new performance layer and decision layer products. • Improve METOC product generation and delivery processes, product quality, assessments of uncertainty and confidence in products, product usage, and outcomes of warfare operations. • Calculate return on investment (ROI) from METOC R&D, product development, education and research, and other METOC community expenditures. • Make management decisions based on objective data (conduct fact-based management). • Allow CNMOC to more effectively participate in fleet synthetic training, reconstruction and analysis (R&A), campaign analysis, and other modeling, simulation, and assessment programs. • * We define the terms products and support broadly to include all types of METOC products, services, and other types of support for operations (e.g., analyses, forecasts, recommendations, etc.). 4 ASW METOC Metrics Overview, Jan 08, murphree@nps.edu
Tier 3 – Decision Layer Tier 2 – Performance Layer Tier 1 – Environment Layer Fleet Data Initial and Boundary Conditions Satellites METOC Metrics: Key Concepts METOC metrics address all BonD levels --- in particular, product performance and operational impacts at each of the three layers. 5 ASW METOC Metrics Overview, Jan 08, murphree@nps.edu
METOC Metrics: Major Objectives and Questions • Objectives • Design, develop, test, and implement objective, quantitative tools to assess our ability to provide effective and efficient METOC support in all three BonD tiers. • Identify gaps in METOC support. • Identify and prioritize improvements needed to fill gaps. • Major Questions • In what ways does the METOC community impact the fight? • How can we measure those impacts? • How can we use those measures to improve our impacts? 6 ASW METOC Metrics Overview, Jan 08, murphree@nps.edu
METOC Metrics: Additional Questions • How good is METOC support for warfare operations? • In what ways, if any, is METOC support good enough? • What are the gaps in METOC support? • Which METOC products are really worth generating? • Is there a more efficient way to produce these products? • What is the uncertainty in our products? • How much confidence should we and our customers have in our products? • What difference does METOC support make in the planning and execution of warfare operations? • How could we improve the impacts of METOC support on operations? • How do we monitor the performance and impacts of METOC support on warfighter effectiveness in an efficient, routine, and continual manner that facilitates fact-based management of personnel, funds, and other resources? 7 ASW METOC Metrics Overview, Jan 08, murphree@nps.edu
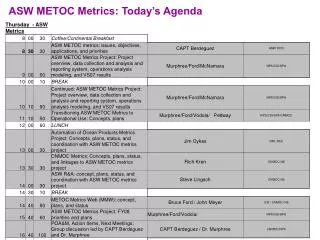
Mission Planning Uncertainty Forecast Uncertainty Mission Performance Forecast Performance Predicted (better outcome) Actual (worse outcome) Actual (worse environment) Predicted (better environment) Mission Outcome Uncertainty better Actual Environment better worse Predicted Environment Effects of Environmental Uncertainty on Mission Planning and Execution Murphree et al., METOC Metrics, Jan 07, murphree@nps.edu Accurate Predictions • Opportunity Costs • Actual is better than predicted • Over-prepared for environmental risks • Spend too many resources, too much time • Resources better used for other locations/missions • Effectiveness Costs • Actual is worse than predicted • Under-prepared for environmental risks • Deploy too few resources, too little time • Increased risk of mission failure Need to know relationships between forecasts, planning, and outcomes in order to quantify, and eventually reduce, outcome uncertainty and associated costs.
METOC Metrics: Steps for Developing a Metrics System • Determine what we want to know and be able to do once we have a fully • functioning metrics system. • 2. Determine what metrics we need in order to know and do these things. • Determine what calculations need to be done in order to come up with the • desired metrics. • Determine what data needs to be collected in order to do the desired • calculations (i.e., data analyses). • Determine the process to use to collect and analyze the needed data. • 6. Implement the data collection and analysis process. • a. If data can be collected, go to step 7. • b. If data can't be collected, repeat steps 1-5 until it can be. • Use metrics obtained from steps 1-6 to improve processes, products, and • operational impacts. • 8. Assess the results of steps 1-7. • 9. Make adjustments to steps 1-8. • 10. Repeat steps 1-9 until satisfied with the process and the outcomes from the • process. Steps above describe the process for the real world data component of a METOC metrics project. The steps are the same for the operational analysis and modeling component of the project, except for steps 4-6 in which data collection is replaced by modeling and generation of model output (model proxy data). 9 ASW METOC Metrics Overview, Jan 08, murphree@nps.edu
Definitions • Metrics: Objective, quantitative, data based measures of operations, products, and services. Examples: • Metrics of product quality • Metrics of effects of products on customers • METOC Metrics: Metrics of METOC organization’s products and impacts. Two main types: • Performance metrics: metrics of capacity, readiness, quality, efficiency / return on Investment • Impacts metrics: impacts on warfare customer operations (planning, execution, post-assessment) • Methods for Generating METOC Metrics • Collect / analyze real world data on METOC and customer ops • Model METOC and customer ops Murphree et al., METOC Metrics, Jan 07, murphree@nps.edu
Operational Outcomes Operational Plans METOC Forecasts * METOC Observations Operational Performance Metrics METOC Performance Metrics Metrics of METOC Impacts on Operational Performance Apply this process to both real world data and output from warfare operations models. METOC Metrics: Data and Methods 11 * or other products ASW METOC Metrics Overview, Jan 08, murphree@nps.edu
Methods Murphree et al., METOC Metrics, Jan 07, murphree@nps.edu • Develop automated system to collect and analyze real world • data. • Develop and apply warfare mission model. • Use real world data to modify and verify model. • Use model to identify additional data to collect and analyses to • conduct.
Major Results • 1. Real World Metrics: • --- Based on Navy and AF data • ---Product performance metrics (aka quality metrics) • --- Operational impacts metrics (aka impacts metrics) • 2. Online Real World Metrics System: • --- Collects and analyzes data • --- Produces forecast performance and operational impacts • metrics • 3. Mission Models: • --- Modeling system for simulating impacts of forecasts and • observed weather on strike operations • --- Produces simulated operational impacts metrics Murphree et al., METOC Metrics, Jan 07, murphree@nps.edu
Forecast Performance Metrics: OIF Forecast Accuracy, Mission X, Location Y March Front % fcst accuracy for al RYG fcsts forecast lead time April Front % fcst accuracy for al RYG fcsts forecast lead time From NPS thesis research of LCDR Jake Hinz, USN, 2004 For official use only Murphree et al., METOC Metrics, Jan 07, murphree@nps.edu
24% Observed and Forecasted Conditions Category % Weather Cancellations Forecast Performance and Operational Impacts Metrics: OIF From NPS thesis research of LCDR Jake Hinz, USN, 2004 For official use only Murphree et al., METOC Metrics, Jan 07, murphree@nps.edu
Forecast Performance Metrics: AMC False Alarm Rate for No Go Mission Execution Forecasts Minimum Performance Benchmark? Target Benchmark? From NPS thesis research of Capt Jeff Jarry, USAF, 2005 For official use only Murphree et al., METOC Metrics, Jan 07, murphree@nps.edu
Operational Impacts Metrics: Negative METOC Impacts Avoided Air Mobility Command WXM Unit, FY 2004 Number of Weather Mitigation Actions Taken by Operators Estimated Number of Missions Saved Estimated Number of Unnecessary Actions Taken 130 120 110 100 90 80 70 60 50 40 30 20 10 0 Saved Mission: a. No Go forecast for original plan is accurate; and b. Go forecast for accepted mitigation plan is accurate; and c. Mission successful using mitigation plan; and d. Mission would have failed using original plan. APR OCT NOV DEC JAN MAR MAY JUN JUL AUG SEP FY04 AVG FEB From NPS thesis research of Capt Jeff Jarry, USAF, 2005 For official use only Metrics, murphree@nps.edu, Nov07
Online Real World Metrics System – Overview • A web based system for use by METOC units in measuring forecast performance, and the operational impacts of: a. Forecasts b. METOC phenomena • Allows near real time data entry by METOC units. • Delivers metrics reports within seconds of data being entered. • Standardized for use by METOC units supporting strike operations, but readily adaptable to other customer operations. • Includes database for long term data collection and analyses. • Optimized for low impact on work loads of METOC units and their customers. Murphree et al., METOC Metrics, Jan 07, murphree@nps.edu
Online Real World Metrics System – System Schematic Carrier Strike Group (CSG) Data obtained by CSG personnel via interaction with air wing NPS Data written to database Data analyzed per NPS metrics procedures Output reports delivered via web site. Reports available to CSG on demand via automated metrics calculation process. Reports delivered by OA division to air wing personnel Data entered remotely via web site CSG From NPS thesis research of LT Jeremy Callahan, USN, 2006 Murphree et al., METOC Metrics, Jan 07, murphree@nps.edu
Online Real World Metrics System – METOC Support and Data Collection During Mission Planning and Debriefing 3 Hours Prior 3 – 4 Days Prior • Flight Brief • DD-175 and safety of flight • Airfield forecast • Enroute & target weather • Divert weather • Launch and recovery weather • ATO Development • Weather briefing given to ATO planners at the Combined • Air Operations Center (CAOC) • ATO developed based on needs of the Combined Forces • Air Component Commander (CFACC) while taking large • scale weather into consideration • ATO promulgated to supporting units • Event Debrief • Data collected during standard Intelligence debriefing • Most weather impacts reviewed for intelligence report • Supplemental data obtained one-on-one after intelligence debriefing Mission Execution 1-2 Hours After From NPS thesis research of LT Jeremy Callahan, USN, 2006 Murphree et al., METOC Metrics, Jan 07, murphree@nps.edu
Online Real World Metrics System – Data Collection From NPS METOC Metrics SIPRNet Site: http://web.ntsstl.nps.navy.smil.mil/Metrics/shipboard_metrics/strike_metrics/index.php From NPS thesis research of LT Jeremy Callahan, USN, 2006 Murphree et al., METOC Metrics, Jan 07, murphree@nps.edu
Online Real World Metrics System – Data Collection Mission Information Debriefing Information NPS METOC Metrics SIPRNet Site: http://web.ntsstl.nps.navy.smil.mil/Metrics/shipboard_metrics/strike_metrics/index.php From NPS METOC Metrics SIPRNet Site: http://web.ntsstl.nps.navy.smil.mil/Metrics/shipboard_metrics/strike_metrics/index.php From NPS thesis research of LT Jeremy Callahan, USN, 2006 Murphree et al., METOC Metrics, Jan 07, murphree@nps.edu
Online Real World Metrics System – Data Collection Observed Negative Weather Events Forecast Negative Weather Events Impacts of Weather on Mission Changes Made to Original Mission by Pilot Target Changes and Cancellations From NPS METOC Metrics SIPRNet Site: http://web.ntsstl.nps.navy.smil.mil/Metrics/shipboard_metrics/strike_metrics/index.php From NPS thesis research of LT Jeremy Callahan, USN, 2006 Murphree et al., METOC Metrics, Jan 07, murphree@nps.edu
Forecast Performance Metrics: False Alarm Rate by Mission Phase – Carrier Strike Groups Representative CV / CVN results 27 Metrics, murphree@nps.edu, Nov07
Forecast Performance Metrics: Probability of Detection of Negative Impact Phenomena – ACC & PACAF 100.00% 90.00% Planning Forecast 80.00% Mission Execution Forecast 70.00% 60% 60.00% 50.00% POD Forecast accuracies and probabilities of detection for negative impact phenomena 60% for all our real world Navy and Air Force data sets. 40.00% 30.00% 20.00% 10.00% 0.00% Cloud Ceiling Cloud Layers Surface Vis Vis Aloft In-flight Icing Icing Run Times Turbulence Contrails Negative Impact Weather Phenomena From NPS thesis research of Maj Karen Darnell, USAF, 2006 For official use only Metrics, murphree@nps.edu, Nov07
ASW METOC Data & Forecast Performance – VS07 SLD: Actual vs. Predicted MPRA NOAT predictions and AXBT measurements of sonic layer depth (SLD) from Valiant Shield 2007 (VS07; preliminary data analysis).Note tendency to under-predict SLD by about 50 ft. Actual Predicted Source: VS07 MPRA data collection forms Murphree and Ford, VS07 Findings, 31 Jan 08, murphree@nps.edu, bruce@clearscienceinc.com
NOAT Recommendations - VS07 Source: VS07 NOAT data collection forms Murphree and Ford, VS07 Findings, 31 Jan 08, murphree@nps.edu, bruce@clearscienceinc.com
NOAT Recommendations – VS07 *Commonly reported by CTF74 due to CTF74 not being in a position to mandate recommendations Source: VS07 NOAT data collection forms Murphree and Ford, VS07 Findings, 31 Jan 08, murphree@nps.edu, bruce@clearscienceinc.com
METOC Metrics Program - Reports Program reports and briefs available at: http://wx.met.nps.navy.mil/metrics/metrics_reports.html Metrics, murphree@nps.edu, Nov07
ASW METOC Metrics: Contact Information • Systems Planning and Analysis, Inc. • 2001 N. Beauregard Street • Alexandria, VA 22311 • Fax: 703-399-7365 • Paul Vodola, Ph.D. • Email: pvodola@spa.com • Paul.Vodola_Contractor@spa.dtra.smil.mil • Phone: 703-399-7225 • Matt McNamara • Email: mmcnamara@spa.com • Phone: 703-399-7266 • Luke Piepkorn • Email: lpiepkorn@spa.com • Phone: 703-399-7239 • Ed Weitzner • Email: eweitzner@spa.com • Phone: 703-399-7229 Naval Postgraduate School Department of Meteorology 254 Root Hall, 589 Dyer Road Monterey, CA 93943-5114 Fax: 831-656-3061 Tom Murphree, Ph.D. (project lead) Email: murphree@nps.edu murphrjt@nps.navy.smil.mil Phone: 831-656-2723 David Meyer Email: dwmeyer@nps.edu Phone: 831-656-3647 Clear Science, Inc. 7801 Lonestar Rd Suite #17 Jacksonville, FL 32211 Fax: 904-379-9704 Bruce W. Ford Email: bruce@clearscienceinc.com fordbw@tsc-jax.navy.smil.mil Phone: 904-379-9704 Manuel Avila Email: manny@clearscienceinc.com Phone: 904-379-9704 41 Ford B and T. Murphree, ASW Metrics ,08, Jan 08, bruce@clearscienceinc.com, murphree@nps.edu
METOC Metrics: Return on Investment (ROI) • Objective, quantitative, automated, near real time assessments of existing and emerging METOC, including assessments of: • a. METOC product generation and delivery processes • b. Product quality • c. Uncertainty and confidence in products • d. Product usage • e. Impacts of METOC support on outcomes of ASW operations • 2. Datasets, models, data analyses, and assessments that Increase CNMOC’s ability to: • a. Evaluate and mitigate environmental risks to ASW • b. Effectively participate in ASW fleet synthetic training, • reconstruction and analysis, campaign analysis, and other • modeling, simulation, and assessment programs • c. Conduct fact-based decision making in planning and in • management of CNMOC personnel and other resources 43 ASW METOC Metrics Overview, Jan 08, murphree@nps.edu
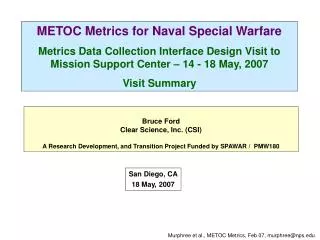
Organizational Axis Spatial/Temporal Axis Whole organization Multiple regions, long period METOC Performance Proxy Ops Impacts Operational Impacts Metrics Type Axis Multiple units Small region, short period Individual unit For details on this figure, see speaker notes section of this slide and symposium summary. Metric process to be conducted in this 3-D space and continuously over time. time 3-D METOC Metrics Space
Organizational Axis Spatial/Temporal Axis Whole organization Multiple regions, long period METOC Performance Proxy Ops Impacts Operational Impacts Metrics Type Axis Multiple units Initial focus region (~next 1-3 years) Small region, short period Individual unit For details on this figure, see speaker notes section of this slide and symposium summary. Metric process to be conducted in this 3-D space and continuously over time. time 3-D METOC Metrics Space:Initial Focus Region
Organizational Axis Spatial/Temporal Axis Whole organization End state focus region (3+ years ahead) Multiple regions, long period METOC Performance Proxy Ops Impacts Operational Impacts Metrics Type Axis Multiple units Small region, short period Individual unit For details on this figure, see speaker notes section of this slide and symposium summary. Metric process to be conducted in this 3-D space and continuously over time. time 3-D METOC Metrics Space:End State Focus Region
METOC Performance Proxy Ops Impacts Operational Impacts Metric process to be conducted in this 3-D space and continuously over time. time Organizational Axis Spatial/Temporal Axis Whole organization Multiple regions, long period Metrics Type Axis Multiple units Small region, short period Individual unit
Organizational Axis Spatial/Temporal Axis ASW community Multiple ops areas, several years CNMOC SLD forecast accuracy to screen penetration correlation SLD forecast accuracy T forecast accuracy Metrics Type Axis Exercise region, several weeks RBC Single point, one day NOAT/NOAD
METOC Performance Proxy Ops Impacts Operational Impacts Metric process to be conducted in this 3-D space and continuously over time. time Organizational Axis Spatial/Temporal Axis Whole organization Multiple regions, long period Metrics Type Axis Multiple units Initial focus region (~next 1-3 years) Small region, short period Individual unit
METOC Performance Proxy Ops Impacts Operational Impacts Metric process to be conducted in this 3-D space and continuously over time. time Organizational Axis Spatial/Temporal Axis Whole organization End state focus region (3+ years ahead) Multiple regions, long period Metrics Type Axis Multiple units Small region, short period Individual unit
Real World Data Collection and Analysis Operational Engagement Model Real World Metrics Model Metrics • Synthesis • improved metrics • process improvements • improved warfighting operations Integration of Real World and Model Metrics Murphree et al., METOC Metrics, Jan 07, murphree@nps.edu