Download
1 / 18
180 likes | 323 Vues
Decadal sea level variations in the North Atlantic and Arctic Oceans Kristine S. Madsen and Torben Schmith Centre for Ocean and Ice, Danish Meteorological Institute. Overview. Introduction Tide gauge observations A composite record for the Nordic Seas

E N D
Decadal sea level variations in the North Atlantic and Arctic OceansKristine S. Madsen and Torben SchmithCentre for Ocean and Ice, Danish Meteorological Institute
Overview Introduction Tide gauge observations • A composite record for the Nordic Seas • The observed sea level signal of the 1940’s Model analysis • Characteristic time scales of the North Atlantic and the Arctic Oceans • Climate model sea level and the 1940’s Summary
Introduction • Global sea level changes are overlaid by regional variability • Here, we focus on multidecadal variability in the North Atlantic and Arctic sea level • Recent multidecadal variability in the North Atlantic area • warming of the 1940s • warming of recent decades • intervening cool period
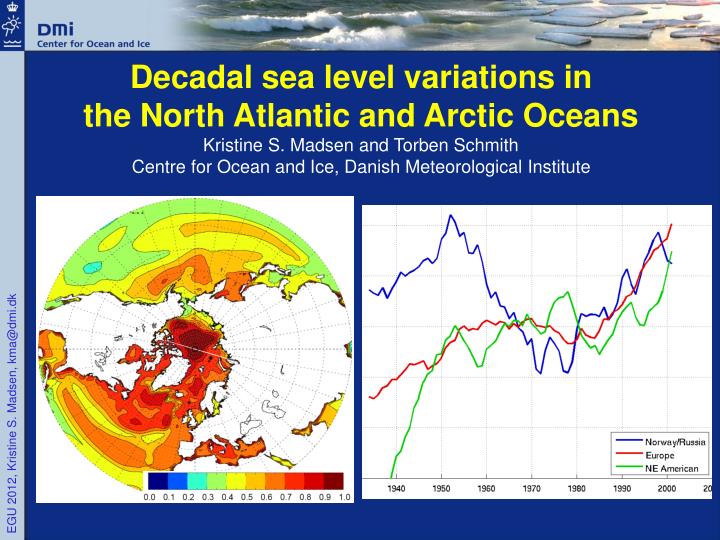
Tide gauge observations Monthly RLR data from PSMSL • All records north of 60N except Baltic with at least 50% available data during 1940-1949: 5 Norwegian and 2 Russian • 5 European stations • 5 NE American stations b c a
Norwegian/Russian composite record – monthly data • Monthly data used • 1925-2010 Units: m
Norwegian/Russian composite record – annual mean • Annual mean if at least 9 month available • Mean and linear trend removed to remove land rise effects Units: m
Norwegian/Russian composite record • Records now comparable Units: m
Norwegian/Russian composite record • Records now comparable • Ensemble mean Units: m
Norwegian/Russian composite record – running mean • Running mean • 10 years (blue) • 19 years (green) Units: m
Running mean records Units: m
The EC-Earth model Fully coupled GCM Two sets of runs: • 600 years control run (pre-industrial forcing) • Ensemble of historic runs 1850 – now Atmosphere GCM: IFS Land: IFS H-tessel Vegetation: Orchideel/LPJ Coupler: OASIS3 ATM Chemistry and aerosols: TM5 Ocean GCM: NEMO Sea-ice: LIM2/3 Ice Sheets Hazeleger et al., 2010 Sterl et al., 2011 ECMWF system Current EC-Earth addition Off-line in EC-Earth
Modeled sea level – control simulation Control run: 600 years,fixed preindustrial forcing Model sea level includes: • Non-global steric variations (both S and T) • Dynamic variations But not global mean steric changes Area means over 3 selected areas show multidecadal variability North Atlantic Nordic Seas Arctic Ocean 2099
Low frequency variability • Decadal and longer variability relative to total variability • More long-term variability in the North Atlantic than in the North Pacific • Strong Arctic signals
Low frequency variability All three areas included in observational study show large natural multidecadal variability
Modelled “historic” sea level signal • Simulation 1850-now, statistical representation of historic development • Two ensemble members shown • No agreement on 1940’es warming. This indicates natural varia-bility • Recent years above ave-rage, must be overlain with global signal (needs further analysis) North Atlantic Nordic Seas
Summary • Observations and model show that the North Atlantic and the Arctic Ocean are areas with large multidecadal variability in sea level. • The Norwegian/Russian sea level curve shows high values in the 1940-1950, model results indicate that it is due to natural variability. • The three observed sea level curves analysed here agree well in recent years and show relatively large trends after about 1990.