Download
1 / 36
400 likes | 918 Vues
Economics of Non-Renewable Resources. Professor Anil Markandya Department of Economics and International Development University of Bath hssam@bath.ac.uk tel. +44 1225 386954 Environmental Economics 2 March, 10 2006. What We Will Cover.

E N D
Economics of Non-Renewable Resources Professor Anil Markandya Department of Economics and International Development University of Bath hssam@bath.ac.uk tel. +44 1225 386954 Environmental Economics 2 March, 10 2006
What We Will Cover • Economics of Depleting an Exhaustible Resource – What Positive Theory Says • Economics of Exhaustible Resources – What the Evidence Says • Economics of Exhaustible Resources – What Normative Theory Says • Using Normative Theory to Look Forward – How Fast Should We Use Exhaustible Resources?
Positive Economics of ER • Assume • Zero extraction costs • Many producers • Fixed constant real rate of interest (r) • Price of the resource at time t is P(t) • In 1931 Hotelling showed that in this case a single producer will maximize profits when the proportional price of the resource rises at the rate of interest
Positive Economics of ER • If LHS is greater than RHS it pays to reduce extraction • If LHS is less than RHS it pays to increase extraction • But note, adjustment is inherently unstable!
Positive Economics of ER: No Substitute for the ER • Resource is progressively exhausted on the price path. • Eventually resource may be exhausted but this can take infinitely long! Price Quantity Time
Positive Economics of ER: Backstop Exists For the ER Price of Backstop • Resource is progressively exhausted on the price path. • But now when price reaches Backstop Price the producer must have nothing left. • For this to work initial price must be ‘correct’ • Lower is r, higher is initial price and lower is extraction initially Price Quantity Time
Positive Economics of ER: Central Planner • It can be shown that the perfect competitive equilibrium is also the solution that would maximize the sum of consumer and producer surplus – I.e. a solution that a central planner would choose. • Holds as long as CP has a discount rate equal to the interest rate. • And as long as all costs of extraction are included in competitive model (I.e. no externalities)
Positive Economics of ER: Monopolist • A monopolist will extract the resource at a rate such that proportional marginal revenue increase at the rate of interest. I.e. She takes account of the effect that extraction has on the price.
Positive Economics of ER: Monopolist Total Revenue and is given as TR Q is quantity Marginal Revenue is given as MR We require
Positive Economics of ER: Monopolist and Competitor Quantity Competitive Producer Monopolist Time
Positive Economics of ER: Extensions to Basic Model • Effect of Extraction Costs • Now net income (price minus extraction cost) must rise at rate of interest. • But if extraction costs fall, then initially extraction increases. Backstop Slower Extraction Initial Price Path Faster Extraction Price Path After Fall in Cost
Positive Economics of ER: Extensions to Basic Model • Capital Costs • These are part of extraction costs and are sensitive to interest rates. If ‘r’ rises then extraction costs rise, resulting in slower extraction. But higher is ‘r’ faster is extraction on Hotelling grounds. • Technology Changes • If backstop price falls, extraction must increase. • If technology lowers extraction costs, extraction also increases initially.
Positive Economics of ER: Extensions to Basic Model • New Discoveries • Effect is similar to an decrease in the price of the substitute – you extract faster. With unanticipated discoveries we see the following pattern: Price Time
Economics of ER: What the Evidence Says • Barnett & Morse analyzed resource prices (1870 to 1957) and found prices fell. Reasons: • Falling extraction costs • Development of lower cost alternatives • New discoveries • More recent studies note increased prices in 1970s but mainly due to restricted supplies (e.g. OPEC)
Economics of ER: Interpreting the Evidence Says • Other studies point to recent increased costs, possibly due to environmental constraints. • Ecological economists explain the falling prices in terms of markets not reflecting real scarcity till it is too late.
Normative Models for Exhaustible Resources • Optimality in use of resources is not same as efficiency. Optimality takes account of distribution as well (inter and intra generational). • Earlier models of optimal growth sought to maximize discounted present value of utility. • But with exhaustible resources these could imply falling welfare over time.
Normative Models for Exhaustible Resources • This is the result of the shape of the welfare function: adding discounted utilities over time Welfare Could go to zero! Time
Normative Models for Exhaustible Resources • Alternative welfare function is to Maximize the Minimum Welfare across all generations (Maximin, aka Rawls Criterion). • This implies searching for the highest constant consumption path for the economy • Solow (1974) showed that even with exhaustible resources it was possible to find such a path. This is the sustainable consumption path • Hartwick showed further that if certain conditions hold we can get to such a path by investing in reproducible capital an amount equal to the ‘rents’ from exhaustible resource extraction. This also applied to renewable resources if they are being depleted.
How Likely Is It That We Can Attain the Sustainable Consumption Path? • Look forward using data on oil and gas and see: • Are paths of energy use likely to be sustainable? • If so, under what circumstances? • If not, what can we do about it – Rules for Sustainability? • Results are from a major EU project on sustainable consumption and exhaustible resources: SAUNER. Details available from me.
SAUNER Methodology 1. Compiled database of reserves and resources of oil and gas, with projections of likely discoveries over 21st century 2. Compiled scenarios of energy demand 3. Derived Operational Rules for sustainability 4. Applied rules to the empirical data 5. Evaluated policy implications of the results.
SAUNER: Databases of Reserves and Resources • Comprehensive Database of reserves and resources of oil and gas, divided into 12 world regions • Long run supply-cost model, incorporating technical progress • Currently the state of the art in hydrocarbon availability information. • Results are shown on next slide
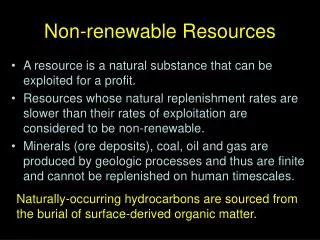
SAUNER: Data on Estimated Current Availability • Current use of hydrocarbons: over 5.5 Gtoe • Estimated availability of hydrocarbons: • Conventional resources – 739 Gtoe = 134 years • Total resources – 3,215 Gtoe = 584 years • Conventional resources @ $30/bbl: 725 Gtoe = 131 years • What happens when we account for economic growth and increasing energy demands?
Scenarios of Energy Demand • Economic growth/energy scenarios of International Institute for Applied Systems Analysis (IIASA) and the World Energy Council (WEC) • 11 world regions, timeframe to 2100 • 6 scenarios, 3 main cases…
Table 2: World Regions Label Region Macro-Region AFR Sub-Sahara Africa Developing Countries CPA Centrally Planned Asia&China LAM Latin America & Caribbean MEA Middle East and North Africa PAS Other Pacific Asia SAS South Asia EEU Central and Eastern Europe Reforming Economies FSU Former Soviet Union NAM North America Industrialised Regions PAO Pacific OECD WEU Western Europe Regions In the Model
Case A: significant technological progress and high economic growth. • Case B: lowertechnological progress, high economic growth; with no significant changes in policies • Case C substantial technological progress, unprecedented international co-operation for environmental protection and international equity • All scenarios assume population grows from 6.1 billion (2000) to 10 billion (2050) and 11.6 billion (2100) • Resulting demands for final energy…
SAUNER: Analysis of the Empirical Data • 1. What are the possible energy price paths? Three possibilities explored: • Maximum price paths – the marginal value product of energy in production • Minimum price paths – the final energy price required for energy investments to make moderate return • Intermediate price path
SAUNER: Investment and Sustainability Implications of the IIASA/WEC Scenarios • 1.What are the implied levels of per-capita consumption associated with the growth scenarios? • Per capita consumption rises in all scenarios, but inequality increases • 2. Are historical and current savings rates high enough to cover the total investment required to support the growth scenarios? • For some regions, particularly Africa and Former Soviet Union, required savings rates are greater than current rates
Investment and Sustainability Implications of the IIASA/WEC Scenarios • 3.How do the rates of return on investment in energy generation compare with projected rates of return to investment in manmade capital? • If returns to energy capital are lower than general interest rate, insufficient investment could result…
SAUNER: What are the Implications of Energy Prices? • Through the model we find that returns to energy investment are at least as high as alternative investments in most regions. • Exceptions are the most developed regions – North America, Pacific OECD, Western Europe.
SAUNER: Investment in Energy and Resource Rents • 4. What is the relationship between required investment in energy generation and (a) the resource rents on the depletion of non-renewable energy resources, and (b) the capital gains? • If resource rents are significant, investment to compensate for resource depletion falls more heavily on resource producers. • If capital gains more significant, investment falls more heavily on resource-consumers.
SAUNER: Investment in Energy and Resource Rents • Marginal Extraction Cost is 1
SAUNER: Investment in Energy and Resource Rents • Capital Gains are more important than resource rents in all scenarios • In the maximum price scenarios, capital gains are comparable to energy investment requirements • Pure resource rents are insignificant for most regions, even in the maximum price scenarios.