Download
1 / 8
80 likes | 514 Vues
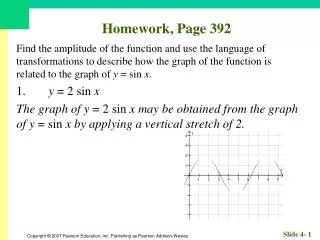
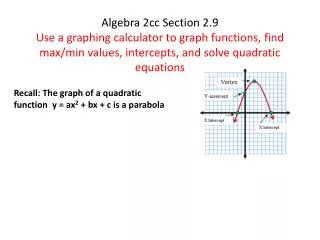
Algebra 2cc Section 2.9 Use a graphing calculator to graph functions, find max/min values, intercepts, and solve quadratic equations. Recall: The graph of a quadratic function y = ax 2 + bx + c is a parabola.

E N D
Algebra 2cc Section 2.9Use a graphing calculator to graph functions, find max/min values, intercepts, and solve quadratic equations Recall: The graph of a quadratic function y = ax2 + bx + c is a parabola
Use a graphing calculator to graph the parabola, find its max/min value, and its x intercepts. y = x2 + x - 6 y = -½ x2 - 3x + 4
Steps to graph a function. • Graph an equation • TI 84 • Set the window (domain and range) by using the keys • Zoom • Zstandard • Y= • Type in the equation using [X,T,θ] for the variable. Press • Graph • TI Nspire • Use scratchpad: [B Graph] • menu • Graph type • Function • Type equation f(x)= • Find the maximum/ minimum/ zero of a function’s graph • TI 84 • Graph the function using the Y= key (see instructions for graphing) • 2nd • Trace • max/min/zero • Move the cursor to the left of the max/min/zero and enter. Move the cursor to the right of the max/min/zero and enter. Move the cursor close to the max/min/zero and enter. The max/min/zero appears at bottom of screen. • TI N-spire • Graph the function (see instructions for graphing) • menu • Analyze graph • max/min/zero • Move the cursor to the left of the max/min/zero and enter. Move the cursor to the right of the max/min/zero and enter. Move the cursor close to the max/min/zero and enter. The max/min/zero appears at bottom of screen.
Use a graphing calculator to graph the parabola, find its max/min value, and its x intercepts. y = 2x2 + 3x + 8
The real solutions to a quadratic equation ax2 + bx + c = 0 can be found using a graphing calculator. Find all real solutions using a calculator. 3x2 + 16x + 5 = 0 • Solve a polynomial equation • TI84 (solve graphically) • Graph the equation as a function. (set it equal to y) • 2nd • Trace • Zero/root • Move the cursor to both sides of the x intercept hitting [enter] on left(lower) and right(upper) bound. The zero(root/solution) will appear at bottom of screen. • TI Nspire • Use scratchpad: [A Calculate] • Menu • algebra • Polynomial tools • Find roots of poly • Enter the degree (2 for quadratic). Enter type of roots (real of complex). Enter the coefficients of the polynomial equation.
Find the real solutions using a graphing calculator. -5x = 2x2 - 7 3x2 + 5x = 2
An object is launched at 19.6 meters per second (m/s) from a 58.8-meter tall platform. The equation for the object's height s at time t seconds after launch is h = –4.9t2 + 19.6t + 58.8, where h is in meters. When does the object strike the ground? When does it reach its maximum height? What is the maximum height?
A rectangle corral is to be built using 70m of fencing. If the fencing has to enclose all four sides of the corral, what is the maximum possible area of the corral in square meters? • Assignment: worksheet