Download
1 / 48
500 likes | 782 Vues
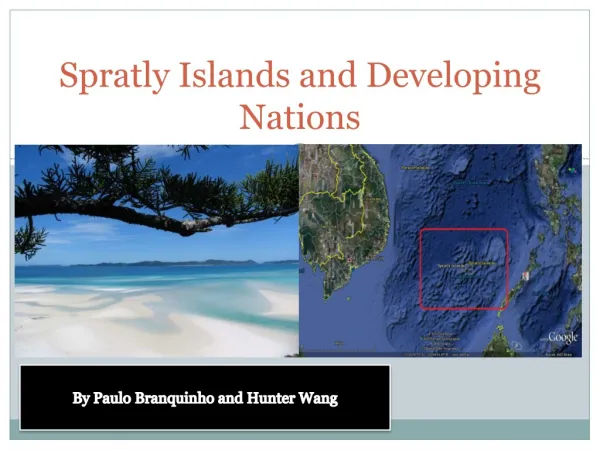
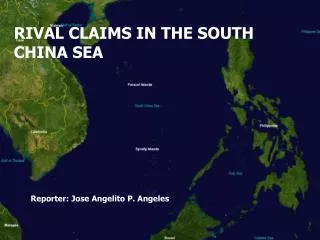
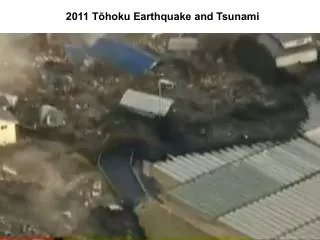
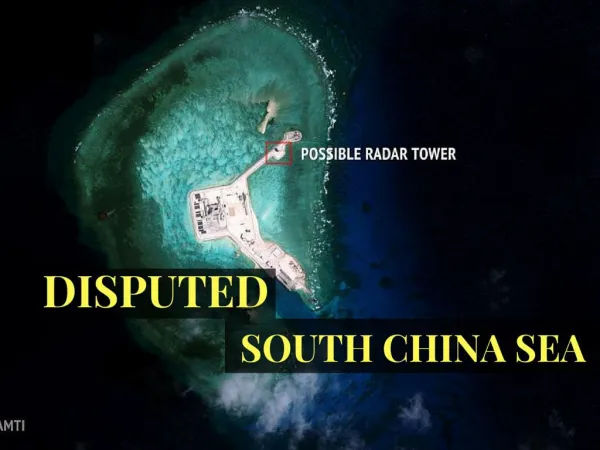
Earthquake and tsunami scenarios in the South China Sea. Vu Thanh Ca Center for Marine and Ocean-Atmosphere Interaction Research Vietnam Institute of Meteorology, Hydrology and Environment 5/62 Nguyen Chi Thanh, Hanoi, Vietnam Email: vuca@vkttv.edu.vn. Tsunami risks at Vietnam coast .

E N D
Earthquake and tsunami scenarios in the South China Sea Vu Thanh Ca Center for Marine and Ocean-Atmosphere Interaction Research Vietnam Institute of Meteorology, Hydrology and Environment 5/62 Nguyen Chi Thanh, Hanoi, VietnamEmail: vuca@vkttv.edu.vn
Tsunami risks at Vietnam coast • There is no tsunami observation system in Vietnam, then no recorded data of tsunami exist. • Historic records: two tsunami events in 1877 and 1882 at Binh Thuan coast (South Central Vietnam), small earthquake caused small tsunami. No life loss or property damage reported • The tsunami events are mainly based on the memory of coastal residents. Almost all cases of tsunami events are confused with storm surge or wind waves. • Two important events: tsunami in Dien Chau (Nghe An Province, at the end of nineteenth century), caused flood with the depth of about 1.5m (in some report, the flood depth is 5m) and penetrated about 1km inland, and tsunami in Nha Trang in 1923 due to Hon Tro volcanic eruption (the recorded material is missing)
Tsunami risk at Vietnam coast • Primary research results of Paleotsunami (Cao Đình Triều, Ngô Thị Lư et al) show that in the past, there was huge tsunami attacking Vietnam coast; • The time tsunami attacking Vietnam coast is 380 years, 610 years and 960 years ago. Thus the tsunami return period is about 310 years???; • The maximum tsunami runup height could be 18m (????);
Various places with tsunami attacking records Tra Co Dien Chau Hue Nha Trang Phan Rang Vung Tau
However, the collected data were not reliable enough, and detailed studies are needed. • The study on the tsunami risk in Vietnam is mainly based on the earthquake data in the South China Sea, especially that from the Manila Trench.
Tsunami source near Vietnamese coast A major fault stretches from Red River to the South of Vietnam. In the Tonkin Gulf and offshore North Central Vietnam, earthquake has the maximum magnitude of 7.5 with the faulting mechanism of the strike slip type. In the offshore South Central Vietnam, the earthquake has the maximum magnitude of 6.5 with the faulting mechanism of the strike slip type. Volcanic activities are mainly offshore of South Central Vietnam coast. Possible land slide exists for all Vietnam coastal shelf
Earthquake in the center of South China Sea: magintude of less than 6.5, strike slip faulting mechanism Risk of tsunami due to land slide and volcanic activities: can be significant for Vietnam, but not yet evaluated
Tsunamigenic earthquake scenarios offshore South Central Vietnam
Manila Trench and Northern Luzon Ridge (Bautista et al, 2001)
Tsunami earthquake scenarios for Vietnam coast • The tsunami generation model: the Okada’s double couple source model (1985, 1997).
Numerical model for the tsunami propagation in the South China Sea • Based on MOST( Tito & Gonzalez, 1997)
Numerical modeling • Discretization schme: Finite volume methods with geological coordinate; • The computed results by the model are used as the boundary conditions for tsunami inundation computation on Vietnam coast.
Scenario Checking results • Computations carried out to check the risks of tsunami due to different earthquake scenarios; • Only earthquake with magnitude greater than 7.5 south of Hainan Island generate significant tsunami at Vietnam coast; • The earthquakes offshore South Central Vietnam do not generate tsunami
Scenario checking results • Earthquake with magnitude greater than 8 can generate significant tsunami at Vietnamese coast.
Determined 12 tsunamigenic earthquake scenarios with corresponding parameters
Fig 1 Tsunami height according to scenario 1 (earthquake M=8 at Manila Trench) Fig 2. Tsunami propagation time from the source (hours) Results of tsunami computation at the Vietnam coast
Fig 3 Tsunami height according to scenario 3 (earthquake M=8.5 at Manila Trench) Fig 4 Tsunami height according to scenario 5(earthquake M=9 at Manila Trench) Results of tsunami computation at the Vietnam coast
Fig 4 Tsunami height according to scenario 10 (earthquake M=9.0 at Ryukyu Trench) Fig 4 Tsunami height according to scenario 11 (earthquake M=7.5 south of Hainan) Results of tsunami computation at the Vietnam coast
Remarks • The risk of tsunami at Vietnam coast is small; • Results of computation show that the most dangerous earthquakes are that with magnitude of greater than 8 in the Manila Trench; • The possible strongest earthquake in the Manila Trench have the magnitude of 8.5. Thus, tsunami risk at Vietnam coast exists; • An earthquake with the magnitude of 9 in Ryukyu Trench and earthquake with magnitude of 7.5 at south Hainan island may cause significant tsunami at Vietnam coast;
A numerical Model for tsunami runup based on spacial averaging operator • Wetting/Drying grid mesh technique is often used when simulating tsunami intrusion inland • It is very difficult to simulate the tsunami intrusion inland with small grid mesh due to excessive computational time and memory; • Use of large grid mesh can create significant error if it is assumed that the grid mesh at the tsunami front is fully wet
The spatial averaged value of a physical quantity is defined as With Sw is the wetted surface inside a grid mesh (a cell), ds is a surface element area The relationship between ensemble average and spatial average is obtained by modifying the formula of Crapsite et al (1986) and Hiraoka (1990) and is expressed as As the effective surface function With
Derivation of main equations of the model • The main equations of the model are derived by applying the above-mentioned spatial averaging procedures to the shallow water equations and continuity equation
Spacial averaged governing equations Continuity equation Momentum equations
Wave generator 1 0.38m 0.4m 35 Experiments by Ting and Kirby (1994, 1995, 1996)
Computed and observed phase-averaged water surface elevation at (x-xb)/hb=7.462. Spilling breaker.
Computed and observed phase-averaged water surface elevation at (x-xb)/hb=7.462. Spilling breaker.
Computed and observed phase-averaged water surface elevation at (x-xb)/hb=10.528. Spilling breaker
Comparison between observed and computed time averaged wave height, highest, lowest and mean water surface elevation for spilling breaker. Experimental data from Ting and Kirby (1994, 1995).
Computed and observed phase-averaged water surface elevation at (x-xb)/hb=6.494. Plunging breaker.
Computed and observed phase-depth averaged relative advective transport rate of TKE in the horizontal direction at (x-xb)/hb=6.494. Plunging breaker.