Flight Planning
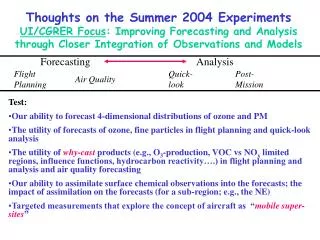
Forecasting Analysis. Flight Planning. Quick-look. Post-Mission. Air Quality. Thoughts on the Summer 2004 Experiments UI/CGRER Focus : Improving Forecasting and Analysis through Closer Integration of Observations and Models. Test:

Flight Planning
E N D
Presentation Transcript
Forecasting Analysis Flight Planning Quick-look Post-Mission Air Quality Thoughts on the Summer 2004 ExperimentsUI/CGRER Focus: Improving Forecasting and Analysis through Closer Integration of Observations and Models • Test: • Our ability to forecast 4-dimensional distributions of ozone and PM • The utility of forecasts of ozone, fine particles in flight planning and quick-look analysis • The utility of why-castproducts (e.g., O3-production, VOC vs NOx limited regions, influence functions, hydrocarbon reactivity….) in flight planning and analysis and air quality forecasting • Our ability to assimilate surface chemical observations into the forecasts; the impact of assimilation on the forecasts (for a sub-region; e.g., the NE) • Targeted measurements that explore the concept of aircraft as “mobile super-sites”
We Plan to Forecast Size + Chemically Resolved Aerosol Products STEM simulations with on-line SCAPE compared to measurements of ACE-ASIA C-130 Flight 6 Observations from PILS (Weber) Fine Sulfate Fine Nitrate Fine Chloride Total Extinction
Impact of aerosols on photochemistry [Clarke] [Avery]
Is value-added by forecasts of additional species? A Scenario during TRACE-P CO NOx O3
STEM Forecast for ITCT2K2 The locations with maximum O3 and CO may not be the same
Predicted sensitivity of O3 to VOCs and NOx VOC-limited NOx-limited
Influence functions (over Cheju for O3 concentrations at 0:0:00 UT, 3/07/01) wrt O3, NO2, HCHO at -48, -24, -12 hr
Combining Back Trajectory and CMB Analysis to Estimate Contributions to Fossil, Biofuel and Open Biomass Burningto Airmasses 2-D and 3-D analysis features for DC8 flight8 (March 9th) Left: same as previous figure, but (light blue: 3.4GMT, purple: 3.3GMT, red: 2.5GMT); Right: same as uppermost figure. Fly by animation
MOZART in ITCT 2K2 • Forecast mode • Driven by NCEP AVN analysis + forecast • Run at NCAR once daily, output every 6 hours • Full gas-phase O3 chemistry, “regional tracers” • Analysis mode • Run after campaign, AVN analysis, higher res. • O3 chemistry + tagged regional CO • Output every 3 hours
Lessons from ITCT 2K2 • Importance of using timely met. forecasts • Comparison of chemical transport model forecasts • Identification of met. features associated with pollution / long-range transport
Examples from ITCT 2K2 • May 05 Flight • Large long-range transport (LRT) event (CO) • May 10 Flight • Stratospheric intrusion (O3)
MOZART for ITCT 2K4 • Aerosol simulation • Sulfate, nitrate, ammonium, black carbon, organic carbon now included • Mineral dust, sea salt being added • Full O3 photochemistry plus tagged CO species • Run at ~2 deg resolution [driven by NCEP GFS ~ 0.5 deg] • Run forecasts 4 times per day out to 84 hours • Output every 3 hours • Automated plots of forecast results posted to web site • Couple with regional model (STEM)
Issues for ITCT 2K4 (vs. 2K2) • Long-range transport (LRT) less important • Should be “easier” for models • But, less lead time • Emission inventories should be more reliable • More emphasis on aerosols • Washout parameterization • Test understanding of organic aerosols • Nighttime chemistry
Science Questions for ITCT 2K4 • Transport • What other U.S. source regions impact pollutant levels in New England? • What are the major export pathways during summer? • Are these pathways well-simulated in models? • Chemical transformations • Can we simulate the chemical evolution of air masses from source regions to the North Atlantic? (e.g., O3 production, NOy partitioning) • Aerosols • What is the composition of aerosols transported from North America to the North Atlantic? • Are aerosol aging and removal processes well-simulated in models? • What are the main sources of organic aerosols?
Development of a General Computational Framework for the Optimal Integration of Atmospheric Chemical Transport Models and Measurements Using Adjoints (NSF ITR/AP&IM 0205198 – Started Fall 2002) A collaboration between: Greg Carmichael (Dept. of Chem. Eng., U. Iowa) Adrian Sandu (Dept. of Comp. Sci., Mich. Inst. Tech.) John Seinfeld (Dept. Chem. Eng., Cal. Tech.) Tad Anderson (Dept. Atmos. Sci., U. Washington) Peter Hess (Atmos. Chem., NCAR) Dacian Daescu (Inst. of Appl. Math., U. Minn.) Goal: To develop general computational tools, and associated software, for assimilation of atmospheric chemical and optical measurements into chemical transport models (CTMs). These tools are to be developed so that users need not be experts in adjoint modeling and optimization theory.
Approach: • Develop efficient algorithms for 4D-Var data assimilation in CTMs; • Develop software support tools for the construction of CTM adjoints; • Apply these techniques to: • (a) analysis of emission control strategies; • (b) integration of measurements and models to produce optimal • analysis data sets for field experiments; • (c) inverse analyses to produce a better estimate of emissions; • (d) design observation strategies to improve chemical forecasting
Iowa/GFDL/Argonne STEM Model Deployment Influence Functions Emission Biases Mesoscale Meteorological Model (RAMS or MM5) MOZART Global Chemical Transport Model Anthropogenic & biomass burning Emissions Meteorological Dependent Emissions (biogenic, dust, sea salt) TOMS O3 STEM Tracer Model (classified tracers for regional and emission types) STEM Prediction Model with on-line TUV & SCAPE STEM Data- Assimilation Model Airmasses and their age & intensity Analysis Chemistry & Transport Analysis Observations
Through a NSF ITR Grant we are developing data assimilation tools – we have a 3-d version ready for application
Forecasting Analysis Flight Planning Quick-look Post-Mission Air Quality Thoughts on the Summer 2004 ExperimentsUI/CGRER Focus: Improving Forecasting and Analysis through Closer Integration of Observations and Models • Test: • Our ability to forecast 4-dimensional distributions of ozone and PM • The utility of forecasts of ozone, fine particles in flight planning and quick-look analysis • The utility of why-castproducts (e.g., O3-production, VOC vs NOx limited regions, influence functions, hydrocarbon reactivity….) in flight planning and analysis and air quality forecasting • Our ability to assimilate surface chemical observations into the forecasts; the impact of assimilation on the forecasts (for a sub-region; e.g., the NE) • Targeted measurements that explore the concept of aircraft as “mobile super-sites”
We Plan to Look for Ways to Improve the Quality of the Emission Inventories by Close Integration with Modeling Activities • Anticipated Activities: • Refine PM Inventories • Refine/Add species to aid in analysis (e.g., OCS, halocarbons, ethanol…). We look for input on species of interest. • Possible other activities: trends, consistent N-Hemisphere inventory, forecasts of emissions,…
STEM schematics for on-line TUV and on-line SCAPE TUV TOP 80km EP/TOMS Ozone (Dobson) O3 (Dobson) below STEM top Overtop O3 = STEM TOP Heterogeneous reactions on BC for NO2, O3, SO2, HNO3 Outputs: Aerosol composition (size-resolved), Aerosol heterogeneous influences, J-values Ice cloud Water cloud Inputs from STEM 3-D field absorption by gas-phase species O3, SO2 and NO2 SCAPE Aerosol Equilibrium Module Surface reflection Aerosols
ITCT2K2 Post-Run with MOZART Boundary Conditions mapped species: O3, CO, ethane, ethene, propane, propene, ethyne, HCHO, CH3CHO, H2O2, PAN, MPAN, isoprene, NO, NO2, HNO3, HNO4, NO3, and MVK Top and Lateral Boundary Conditions from MOZART II every 3 hours STEM 80x70 domain 13.4km Lateral boundary conditions of other species, included SO2 and sulfate still come from the large-scale CFORS tracer model