Download
1 / 37
420 likes | 1.06k Vues
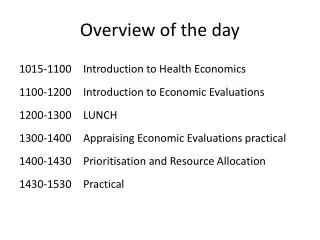
Overview of the day. 1015-1100 Introduction to Health Economics 1100-1200 Introduction to Economic Evaluations 1200-1300 LUNCH 1300-1400 Appraising Economic Evaluations practical 1400-1430 Prioritisation and Resource Allocation 1430-1530 Practical. Introduction to Health Economics.

E N D
Overview of the day 1015-1100 Introduction to Health Economics 1100-1200 Introduction to Economic Evaluations 1200-1300 LUNCH 1300-1400 Appraising Economic Evaluations practical 1400-1430 Prioritisation and Resource Allocation 1430-1530 Practical
Introduction to Health Economics Dr Carol Chatt Dr ArunAhluwalia
Learning Outcomes • Gain a general understanding of health economics • Be aware of different types of economic evaluation • Be able to critically appraise an economic evaluation • Gain an understanding and experience of prioritisation & resource allocation
What do you think? • The over-riding duty of a doctor is to ensure the best possible outcome for their patient …and cost should not be a factor • The patient should not be concerned about the cost of treatment being given to them • Life-saving interventions are preferable to those that improve the quality of life
The NHS context • The NHS has limited resources Although spending has increased!
The NHS context • The public have increasing expectations Source: HES Data
The NHS context • We need to decide what we can afford with our limited budget • Health Economics is about choice • But for every choice there is an ‘opportunity cost’
Key Concept – Opportunity Cost • “The value of foregone benefit which could be obtained from a resource in its best alternative use • E.g. if you have a holiday and you take a 2 week cruise…you forego the opportunity of going skiing
In the NHS, how do we choose which treatments to provide? Economic evaluation
Economic Evaluation • “The comparative analysis of alternative course of action in terms of both their costs and consequences in order to assist policy decisions” (Drummond & McGuire, 2001) • This does not just mean always choosing the cheapest options • We must also consider the consequences (or outcomes) of each option, including equity
Key Concept: Equity • “A system of justice based on conscience and fairness” • Equality is giving everyone the same share • Equity is giving everyone a share according to their need • Horizontal equity – Equal treatment of equals • Vertical equity – Unequal treatment of unequals
Economic Evaluation components • Costs • To the NHS • To the whole public sector (e.g. social services) • To the patient (e.g. time off work, transport to appointments, etc) • (Resources saved) • Consequences • Health state change • Other gains e.g. employment Narrow costing perspective Wider costing perspective
Types of Economic Evaluation • CMA Cost-Minimisation Analysis • CCA* Cost-Consequence Analysis* • CBA Cost-Benefit Analysis • CEA Cost-Effectiveness Evaluation • CUA Cost-Utility Analysis *not considered by some to be a true economic evaluation
1 Cost-Minimisation Analysis • Requires evidence that outcomes are equivalent • Cheapest option is preferable • Simvastatin and Atorvastatin lead to similar cholesterol reductions • Simvastatin 40mg costs £1.17 per month • Atorvastatin 20mg costs £24.64 per month
2 Cost-Consequence Analysis • Costs and consequences are reported separately • Costs and consequences not aggregated into single measures • Needs interpretation – may be influenced by personal judgment
3 Cost-Benefit Evaluation • Costs and consequences measured in terms of money • If sum of consequences is greater than cost, treatment is acceptable • Methodologically can be difficult accurately assigning monetary values • What is the monetary value of an extra 6 months of life? • Also need to consider problems of a fixed budget • E.g. Triptan drug costs £4 per migraine, saved £12.50 in work absences
4 Cost-Effectiveness Analysis • Outcomes measures in ‘natural units’ • E.g. years of life saved, symptom-free days, number of cases detected • Difficult to compare interventions that are measured in different units
5 Cost-Utility Analysis • Consequences presented as a single generic measure (e.g. Quality Adjusted Life Year, QALY) • Similar to CEA but now able to compare consequences of treatments with different outcomes, e.g. life-saving treatments can be compared to life-improving treatments • Which intervention has a better Cost-Utility outcome? • Hip replacement • Coronary Artery Bypass Graft £1100 per QALY gained £2000 per QALY gained
QALYs • Combines: • Quality of Life (QoL) • Length of Life • Measuring QoL: • Can use HRQoL questionnaire e.g. EQ-5D • Or a direct valuation • Visual Analogue Scale • Standard Gamble • Time Trade Off
EQ-5D • Example results for 5 patients using EQ-5D QoL 0 equivalent to death QoL 1 = perfect health QoL <0 = worse than death
Standard Gamble • The respondent chooses between two alternatives with two possible outcomes: a good outcome with the probability p and a bad outcome with the probability of 1-p • The probability of outcomes is varied until the respondent is indifferent about the two alternatives (Columbia University, 2012)
Standard Gamble example • You are paraplegic (can’t walk), and offered a treatment which has: • 70% chance of perfect recovery for 30 years…then death(BUT a 30% chance of instant death) or • Remain in your current health state for 30 years…then death
Standard Gamble example • How about: • 80% chance of recovery with 20% chance of death • Or remain as you are
Time Trade-Off • The respondent is asked to choose between 2 alternatives, e.g. • 30 years as a person with paraplegia or • 28 years of perfect health • 30 years as a person with paraplegia or • 20 years of perfect health
QALYs • QALY = Σ (QoL × Length of time in that state) • 1 QALY is one year of perfect health • Calculating QALYs mini-practical
Advantages of QALYs • A convenient non-monetary unit • Can compare life-extending / life-improving / life-saving interventions
Disadvantages of QALYs • Only considers outcome of patient • Ignores effects on family, society, etc • Only measures health-related effects • Assumes that the value of the health state is independent of the duration • Humans adapt! • Elicitation method • Sensitivity of EQ-5D is a separate issue • Valuation depends on who is asked (Dr > public > patients) • Inherently ageist If you reject QALYs what do you use instead?
How to present your CEA and CUA results (1) • What is the difference in costs and the difference in consequences of a new treatment compared to the current treatment? • The incremental cost-effectiveness ratio (ICER) is: ICER = Difference in costs_______ Difference in consequences • This calculates the cost per extra unit of benefit
How to present CEA and CUA results (2) • The cost-effectiveness plane Difference in cost NE NW Difference in effectiveness Current treatment SW SE
“North West never invest…South East always invest” Difference in cost NE NW New treatment is more expensive and less effective Difference in effectiveness New treatment is less expensive and more effective SW SE
The North East quadrant – A or B ? Difference in cost NE NW A Ceiling Ratio – this is an arbitrary upper limit on what ‘we’ are willing to pay NICE set this at about £20,000 to £30,000 per QALY B Difference in effectiveness Ceiling Ratio (Rc) SW SE
South West quadrant – C or D ? Difference in cost NE NW Ceiling Ratio (Rc) Difference in effectiveness C D SW SE
The cost-effectiveness plane Difference in cost NW NNE Current dominates alternative Ceiling Ratio (Rc) ENE Alternative is cost-effective Difference in effectiveness WSW Alternative dominates current Current is not cost-effective SSW SE
References • Barton P (2012). Lecture: Economic Evaluation in Health Care: an Introduction. • Columbia University (2012). http://people.dbmi.columbia.edu/~cmr7001/sdm/html/methods.htm [accessed 31/08/2012) • Drummond M & McGuire A (2001). Economic Evaluation in Health Care. Oxford: Oxford University Press. • EQ-5D (2012). http://www.euroqol.org/news-list/article/interim-scoring-for-the-eq-5d-5l-eq-5d-5l-crosswalk-index-value-calculator.html [accessed 31/08/2012] • Maheswaran H (2003). Lecture: WM Masterclass. • Wells NE, Steiner TJ (2001). Effectiveness of eletriptan in reducing time loss caused by migraine attacks. Pharmacoeconomics 2001;18:557–66.