Download
1 / 19
190 likes | 278 Vues
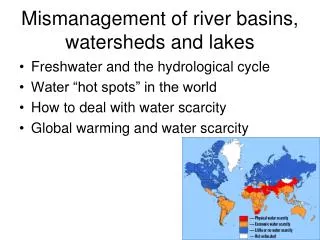
Explore DMIP-2 results on rainfall runoff, infiltration, streamflow, and channel parameterization. Calibration procedures and performance evaluation methods for Illinois and Blue River Basins presented.

E N D
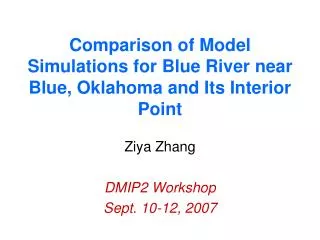
The Distributed Model Intercomparison Project (DMIP-2) Workshop, Sept. 10-12, 2007 Hydrology Laboratory, Office of Hydrologic Development, National Weather Service, 1325 East West Highway, Silver Spring, Maryland 20910 Illinois and Blue River Basins University of OklahomaDMIP2 Results Baxter E. Vieux1, bvieux@ou.edu Jonathan P. Looper2 Maria A. Moreno2 1Professor and Director, Natural Hazards and Disaster Research, 2Graduate Research Assistants, School of Civil Engineering and Environmental Science National Weather Center, 120 David L. Boren Blvd. Suite 3630, Norman Oklahoma 73072 www.nhdr.ou.edu
Rainfall Runon Runon Runoff Runon Infiltration Model FormulationVflo Continuous • Drainage network and hydraulics determine hydrologic response (no unit hydrographs!) • Setup with geospatial data and physically realistic parameters • Infiltration rate and saturation rate excess • Kinematic wave grid-grid and channels • Channel hydraulics include cross-section, rating curves, trapezoidal, modified Puls and looped rating curves
StreamflowBaseflow and Direct Runoff • Baseflow (RORA)– • Hydrograph separation at USGS gauges • Synthetic generation at ungauged locations • Direct Runoff (Vflo)– • Saturation excess • Infiltration rate excess • Continuous soil moisture, PET
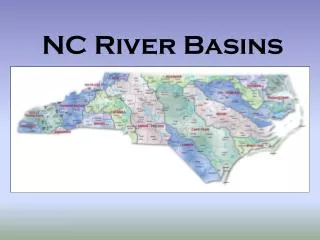
Flow Direction, Accumulation, Slope Topography – Digital Elevation 10-m (USGS) • Aggregated to model resolution: 500-m Blue, and 350-m Illinois • Slope derived from 10-m DEM • Flow accumulation and drainage direction at 500-m
Soil Moisture and Infiltration Soil properties – MIAD 200-m NRCS soils database. • Infiltration rate excess – Initial Green Ampt parameters derived from soil texture (Rawls and Brakensiek, 1983) • Saturation Excess – Soil moisture modeled with potential evapotranspiration when soil moisture is available and it is not raining, daily redistribution, no loss to deep percolation.
Calibration Procedure Ordered Physics-Based Parameter Adjustment (OPPA) Vieux and Moreda (2003) • Estimate spatially distributed parameters from physical properties • Assign channel hydraulic properties based on measured cross-sections where available • Study the sensitivity of each parameter • Determine the optimum parameter set which minimizes the respective objective functions • Adjust volume, followed by parameters affecting timing and peak • Re-adjust parameters to account for interactions
K*1.0 K*1.4 Green and Ampt Infiltration Parameters
Hydraulic Parameterization • NHD+ Streams • Geomorphic Width/Accumulation • Channel slope from 10-m DEM
Calibration Procedure • Separate events by saturation excess versus infiltration excess. The scatter plots provided an insight due to the appearance of two trends between observed and simulated runoff. • Create Objective Functions for peak discharge and event volume. Plot objective function versus soil depth and hydraulic conductivity. Identify the cross correlation between soil depth and hydraulic conductivity. • EvaluateNash-Sutcliffe efficiencyfor each set of soil depth and hydraulic conductivity. The Nash-Sutcliffe efficiency provided a quantification for matching the distributions of observed to simulated streamflow. • The Nash –Sutcliffe efficiency metric was used to assess the calibrated results along with peak and volume bias in the selected events.
RMSE Volume (in) RMSE Peak (cfs) Objective Functions
Oct 1998-May1999 Feb-Jul 1999 Illinios RiverWatts Continuous Hydrographs
Talo2 Watt2 Siloam PerformanceIllinois River
PerformanceBlue River bluo2