Download
1 / 36
360 likes | 388 Vues
Delve into the theory and practice of consumer-driven health plans, exploring the impact on enrollee behavior and cost effects. Learn about Health Savings Accounts, employer contributions, and research findings on CDHPs.

E N D
Consumer Driven Health Plans:Does Theory Follow Practice? Stephen T Parente, Ph.D. Associate Professor of Finance and Director, Medical Industry Leadership Institute University of Minnesota, Carlson School of Management Sponsored by the Robert Wood Johnson Foundation’s Health Care Financing & Organization Initiative (HCFO), the U.S. Department of Health and Human Services and Pfizer
Presentation Overview • What is (or at least what we see and model) a consumer directed health plan? • General introduction and preliminary research findings • Graphic conceptual model of consumer behavior • CDHP cost-sharing design creates a budget constraint with 2 kinks • Contrast with ‘standard’ health insurance that uses coinsurance or deductible • Determine expected effects on enrollee behavior • So is there a difference?
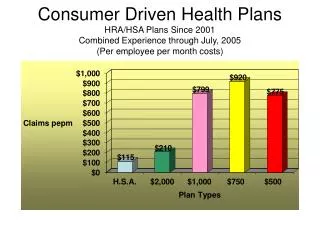
Health Toolsand Resources Health Coverage $$ Annual Deductible Definity HealthCareAdvantage Web- and Phone-Based Tools Preventive Care 100% Annual Deductible ‘Classic’ CDHP Model – HRA • Health Reimbursement Account (HRA) • Employer allocates HRA1 • Member directs HRA • Roll over at year-end • Apply toward deductible2 • Health Coverage • Preventive care covered 100% • Annual deductible • Expenses beyond the HRA HRA • Health Tools and Resources • Care management program • Internet enabled 1 Employer selects which expense apply toward the Health Coverage annual deductible. 2 Paid out of employer’s general assets.
Health Coverage $$ Annual Deductible Preventive Care 100% Annual Deductible CDHP Version 2.0: The Health Savings Account (HSA) HSAs legislated in MMA 2003. Pretty similar to Definity Health HRA Design except the consumers owns the account. HSA
Questions Addressed from Previous Peer-Reviewed Academic Research • Do CDHPs (in the form of HRAs) have national appeal? • Yes. In almost every major market, when introduced, take-up exceeded 5% of employees offered (range 4% to 85%). • Do CDHPs always have favorable selection? • No. While there is some evidence of initial favorable selection in one employer, it does not persist. (Parente, Feldman, Christianson, 2004) • Do CDHPs have different effects on cost & utilization compared to other plans? • Yes. Results depend on benefit generosity. Long run costs are not less with a generous plan. (Parente, Feldman, Christianson, 2004). For less generous plans, preliminary evidence suggest reduction in rate of increase. • Biggest cost impact on pharmacy (least cost increase – Parente, Feldman, Chen, 2007). Little impact on utilization. • Are HSAs a viable approach to addressing the problem of the uninsured? • Yes. But it is still more a political economy question of budgetary priority. Reductions range from 3 million to 25 million newly insured with federal costs as high as $100 billion per year. (Feldman, Parente, Abraham, 2005).
What We Don’t Know? • Do Consumers Respond to the Actual Financial Incentives of a CDHP design? • Incentive #1 – Variation in the Price of Medical Care • Depends on: Contract (single, family) Cost-sharing components (deductible, co-insurance, actual account Transparency of price Ability to shop for better price • Incentive #2 – Save resources in possible for later use • Depends on: Health status Income & wealth Risk aversion Preventive care availability and generosity
Region 3: c to d Goods Region 2: b to c Deductible Budget e Region 1: a to b b a fCo-Insurance Budget c d CDHP Budget Medical Care HRA Deductible Graphic Conceptual Models: CDHP, (C)oinsurance anda (D)eductible Health Plan
Data to Test Hypotheses • Large employer added a CDHP to previously-offered PPO and POS Plans in 2001 • Quasi-experimental pre/post design • We selected 3 cohorts of workers continuously employed from 2000-2003: • Always in PPO • Always in POS • PPO or POS in 2000, switched to CDHP in 2001 and stayed in CDHP 2002 and 2003
Empirical Model – Step 1 • Predict employee’s 2000 spending region on the basis of cohort, contract-level, and employee demographic data • Cohort stands in for unmeasured variables that affect spending • Control for health status using indicators for 34 ‘adjusted diagnostic groups’ (Starfield and Weiner, 1991)
2001-2003 Cost Models – Step 2 • We estimated 2-part models for total $, physician $, Rx $, and proportion of Rx $ on brand-name drugs • 1st part = probit analysis of any $ • 2nd part = log($ $>0) • Models include predicted region x Cohort • Will present ‘key’ results • ALL RESULTS COMPARED to PPO OPTION
Total Expenditure Regressions control for year, age, male, income, covered lives, FSA use, concurrent ‘health shock’; omitted category = POS x REGION1 Translation: CDHP cohorts uses less of any medical or pharmacy in the account phase only. This leads to an 11.6% reduction in expenditures compared to a PPO. Once all cost-sharing is satisfied, CDHP members have 76% higher expenditures then PPO.
Physician Expenditure Regressions control for year, age, male, income, covered lives, FSA use, concurrent ‘health shock’; omitted category = POS x REGION1 Translation: People use less of any physician services in the account phase, but not enough to effect expenditures.
Rx Expenditure Regressions control for year, age, male, income, covered lives, FSA use, concurrent ‘health shock’; omitted category = POS x REGION1 Translation: CDHP cohorts uses less of any pharmacy in the account phase only. This leads to an 35.9% reduction in Rx expenditures compared to a PPO. Once all cost-sharing is satisfied, CDHP members have 66% higher Rx expenditures then PPO.
Brand Name Rx Proportion Regressions control for year, age, male, income, covered lives, FSA use, concurrent ‘health shock’; omitted category = POS x REGION1 Translation: CDHP cohort has a higher probability of any brand name drug use in all expenditure regions compared to PPO.
Summary of Findings (1) • CDHP enrollees predicted to be ‘low spenders’ consistently spent less in following years than a comparison group with conventional cost sharing • This difference was found in all probit equations and for cases with positive total expenditure and Rx expenditure • This finding is striking because CDHP enrollees had no cost-sharing in this region • HRA account provides insurance against future expenses
Summary (2) • CDHP enrollees predicted to be in Region 2 or 3 spent more than the comparison POS group • This finding is similar to our previous cohort study in 2001 and 2002 (Parente, Feldman, Christianson, 2004) • CHDP enrollees in Region 3 have used their accounts and face no cost-sharing at the margin no incentive to conserve on medical care • The maximum out-of-pocket limit is too low • Problem could be addressed by raising the limit and introducing modest coinsurance above the limit
Region 3: c to d Region 2: b to c Region 1: a to b Graphic Conceptual Models: REVISED CDHP, (C)oinsurance anda (D)eductible Health Plan Goods Medical Care Price High Deductible Demand Deductible Budget e b a fCo-Insurance Budget c d CDHP Budget CDHP Demand Medical Care HRA Deductible
What Happens When You Can Choose between an HSA, an HRA, an HMO, a PPO, EPO or a POS plan?2006 Plan Choice Year, 2005 Risk Data
Study Setting • Employer with many different plan design offers in 2006 including: • CDHP: HSA, HRA High, HRA Not-High • PPO, POS, EPO, 1 or 2 HMOs in some locations • Non-retiree analysis only. • Employees live in all 50 states. Over 100 employees in 22 states. • Health risk (including measure of chronic illness) based on 2005 pharmacy claims data.
Plan Design Attributes • Four contract types: • Single • 2 Person • Adult + Child • Family • CDHP Design • HRA High: Coinsurance at 5%, Smaller donut • HRA Low: Coinsurance at 10%, Larger donut • HSA – More out of pocket risk • Non-CDHP Design: Moderate coinsurance (average 10%)
Attributes of Plan Choosers • Notes: • 2006 Plan choice data • Risk ratio based on computation from 2005 pharmacy data • Primary HMO Rx data may be under-represented
HSA Take Up – 2006 Take-up 2.7-5.6% 1.4 – 2.6% <1.4% Data based on 1 large employer representing ~50,000 covered lives with HSA initial year offering in 2006.
CDHP Take Up – 2006 Take-up 11-39% 7.5 – 10% <7.5% Data based on 1 large employer representing ~50,000 covered lives with HSA initial year offering in 2006 along with low and high HRAs.
HSA/PPO Risk Ratio HSA/PPO Ratio 1.0-2.6 0.75 – 0.99 <0.75 Data based on 1 large employer representing ~50,000 covered lives with HSA initial year offering in 2006. Risk Score based 2005 Claims data analysis using RxRisk
HRA High/PPO Risk Ratio HSA/PPO Ratio 1.0-3.7 0.75 – 0.99 <0.75 Data based on 1 large employer representing ~50,000 covered lives with HSA initial year offering in 2006. Risk Score based 2005 Claims data analysis using RxRisk
Summary of HSA Choice when HRA and PPO are Also Choices • Risk-splitting between HRA and HSA • Clearly an issue of benefit design. • Is the risk segmentation of value? Is too difficult to fix short of full-replacement?
“But what do you have that is really current?”To be presented:President Bush’s 2007 State of the Union Health Insurance Proposal Impact from ARCOLA model
2007 State of the Union Estimates $???,???,???,???.00
SOTU 2007 • A tax deduction of $7,500/$15,000 – but you have to have health insurance to get the deduction • Health insurance premiums will be taxable (equal tax treatment of individual and ESI (employer sponsored, a.k.a. group, premiums) • Complicated incentives created by SOTU cannot be modeled by existing economics studies
Simulations • Using a micro-simulation model, we predicted the effect of 2007 SOTU on health insurance take-up and costs • Background: Our model predicted the take-up of HSA plans in the individual market quite accurately (Parente, Feldman et al, 2005) • Population: adults aged 19-64 who are not students, not covered by public insurance, and not eligible for coverage under someone else’s ESI policy • Baseline uninsurance: 27.3 million people • Hold onto your hats…
Thank You!For more information on our research, please visit:www.ehealthplan.orgStephen T. Parente, Ph.D., M.P.H., M.S.Associate Professor, Department of FinanceDirector, Medical Industry Leadership InstituteCarlson School of ManagementUniversity of Minnesota321 19th Ave. South, Room 3-122Minneapolis, MN 55455612-624-1391 (v), sparente@csom.umn.eduhttp://www.tc.um.edu/~paren010